Potential vorticity in the Pacific and Indian Oceans
WOCE Conference, May, 1998
Lynne D. Talley and Mary Cait McCarthy
Scripps Institution of Oceanography, University of California San Diego
La Jolla CA 92093-0230

Abstract
Potential vorticity and especially its horizontal gradient is essential
to propagation of information in the ocean. Even though it is a dynamical
quantity, it is a useful tracer of flow since it has identifiable
sources and sinks, and complements other properties such as
salinity, nutrients and chemical tracers. Potential vorticity
distributions on neutral surfaces in the Pacific and Indian Oceans
have been constructed using the WOCE data sets supplemented by
historical data. Particular attention has been paid to determining
which regions are strongly influenced by the mid-laitude gyre
circulations compared with the tropical regions, surface convection
(mode water/intermediate water/deep water formation areas), and to the
vertical extent of topographic influence. Isoneutral maps of other
properties, such as oxygen and silicate, supplement interpretation
of the potential vorticity fields.

Methods
Isopycnic potential vorticity was calculated as (equation)
from CTD and bottle data. Values from both data types are
comparable. Relative vorticity is neglected. Q is hand
contoured on neutral surfaces (Jackett and McDougall, 1997)
in the Indian Ocean and on potential density surfaces
in the Pacific Ocean. Surfaces represent mode, intermediate
and deep water.

Pacific Ocean
| Density |
Mean Depth |
Water Mass |
|
| sigma0=25.2 |
150m |
North Pacific Subtropical Mode Water |
| sigma0=26.0 |
200m |
South Pacific Subtropical Mode Water |
| sigma0=26.8 |
400m |
North Pacific Intermediate Water |
| sigma1=31.7 |
700m |
Antarctic Intermediate Water |
| sigma2=36.96 |
2700m |
Pacific Deep Water |
| sigma4=45.88 |
4200m |
Lower Circumpolar Deep Water |
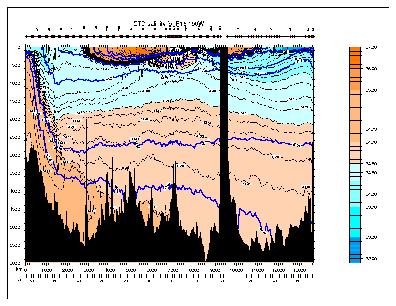
Salinity section along 150W (WOCE P16). Isopycnals used below are shown
as heavy contours.
|
|
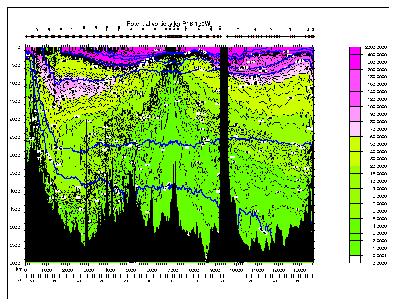
Absolute value of potential vorticity along 150W (WOCE P16) in
units of 10-14 cm-1 sec-1. Isopycnals used below are shown
as heavy contours.
|
|
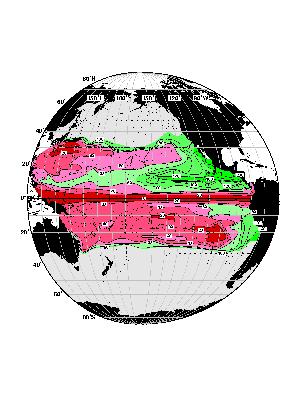
Potential vorticity at sigma_theta = 25.2.
Beta domination equatorward of 3 degrees. Low Q
in the North Pacific is the lightest subtropical mode water (south of Kuroshio Extension).
Low Q in South Pacific associated with the subtropical front in the central basin. High Q
subducted in eastern part of North and South Pacific subtropical gyres.
|
|
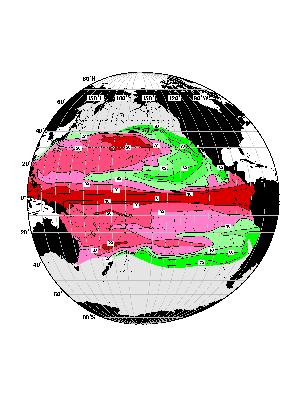
Potential vorticity at sigma_theta = 26.0 Beta domination equatorward of 5 degrees.
North Pacific subtropical gyre - low in north central region, underlying coldest subtropical
mode water (sigma_theta = 25.4). High Q subducted in east and along Kuroshio Extension.
South Pacific subtropical gyre - low north of New Zealand - core of subtropical mode water.
Advected eastward, with westward advection of high.
|
|
Potential vorticity at sigma_theta = 26.8. Beta domination equatorward of 10-15 degrees. In
N. Pacific subtropical gyre - high in Kuroshio and extending eastward across gyre. Slight
low along subarctic front to base of pycnocline. Lowest in Okhotsk Sea. In South Pacific -
lowest in Tasman Sea ACC region where it is the local Subantarctic Mode Water. Some
circulation of this in the Tasman Sea and around New Zealand. Highest in southeast Pacific,
with subducted high carried around gyre to low latitudes.
|
|
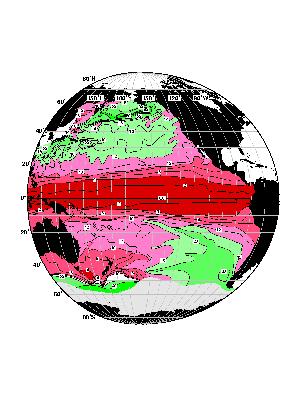
Potential vorticity at sigma_1 = 31.7. Beta domination equatorward of 15-18 degrees. Q
nearly uniform in N. Pacific subtropical gyre except for high along Kuroshio, west-east
gradient in Okhotsk Sea and south-north gradient in Bering Sea. In South Pacific, high Q
along ACC decreasing eastward, lowest in southeastern Pacific, at formation site of AAIW.
Low Q spreads northward by subduction from this region.
|
|
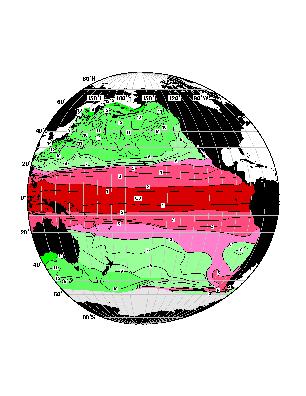
Potential vorticity at sigma_2 = 36.96. Beta domination equatorward of 15-18 degrees.
Nearly uniform Q in North Pacific north of 35N. Low Q in eastern South Paciifc, likely
created by local hydrothermal heating. Strong Q distortion by flow in South Pacific. Banded
high and low Q along ACC - low absolute value of Q on south side and high absolute value of Q
on north side. These would partially compensate for relative vorticity differences on either
side of the ACC.
|
|
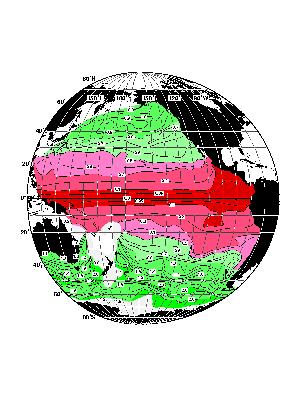
Potential vorticity at sigma_4 = 45.88. Beta domination equatorward of 10 degrees. Strong
topographic effects: in the northern hemisphere, Samoan Passage and the deep western boundary
current distort Q. Island of high Q in central North Pacific. Band of high Q along the
ACC.
|
|
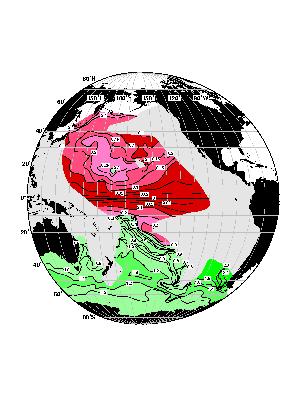
Oxygen (ml/l) at sigma_4 = 45.88. Highest in south, lowest in north. Long zonally oriented
tongues near equator and relatively large northward gradient at 10 S to equator.
[Plot not available (does not convert easily to postscript).]
The tropical beta barrier. As f decreases, potential vorticity must go to zero. At depths
greater than 500 to 700 meters, the switch to beta domination occurs around 15 to 18 degrees
from the equator. At shallower depths, the vigorous subtropical gyre circulations approach
closer to the equator. In the deepest layer, topographic effects also become important.
A simple argument for determining the latitude separating beta domination from gyre
circulations: deviation of Q from beta requires strong enough stretching. At low enough f,
Q is too difficult to deform through stretching. The two terms in the isopycnic potential
vorticity are: (equation beta*y + (f*f/N*N)psi_zz).
Scale values appropriate for the deep ocean yield a latitude of 15-20 degrees for the shift
from stretching to beta domination.

Indian Ocean
The Indian Ocean work is currently in press at J. Geophys. Res.:
McCarthy, M.C. and L. D. Talley, 1999. Three-dimensional potential
vorticity structure in the Indian Ocean. J. Geophys. Res., accepted.
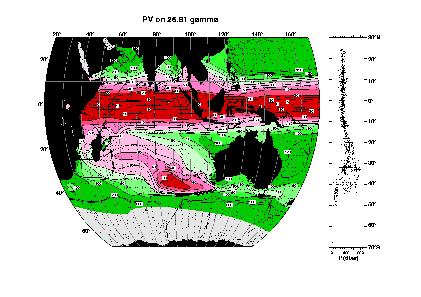
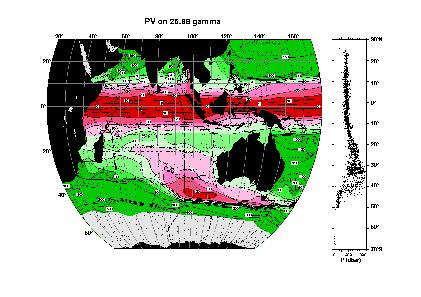
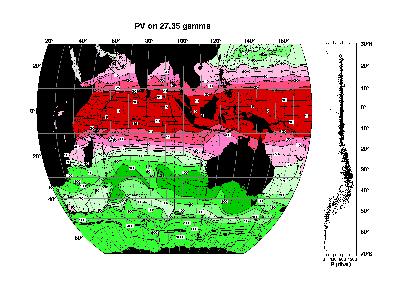
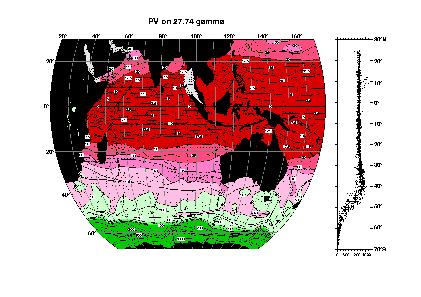
The table and vertical section of gamma-n (neutral density) show the
approximate location of gamma-n surfaces.
| Gamma layer |
Description |
Depth |
Potential density |
|
| 26.81 and 26.88 |
SAMW |
250-400m |
26.73-26.8 sigma_0, 31.24-31.5 sigma_1 |
| 27.15 and 27.35 |
AAIW |
500-1000m |
27.0-27.3 sigma_0, 31.51-31.78 sigma_1 |
| 27.60 and 27.74 |
Intermediate Waters |
1000-1500m |
32.03-32.2 sigma_1, 36.69 sigma_2 |
| 27.95, 28.09 and 28.12 |
Upper Deep Water |
1900-4150m |
36.9-36.91 sigma_2, 41.49-41.53 sigma_3, 45.88-45.89 sigma_4 |
| 28.14 and 28.16 |
Lower Deep Water |
3200-4600m |
41.54-41.56 sigma_3, 45.91-41.94 sigma_4 |
Mode Water. Gamma-n =26.81 and 26.88 show low Q from Subantarctic Mode Water south of
Australia. Through-flow Water has high Q. Tropics are beta-dominated, and north shows
outflows.
|
|
|
Intermediate Water. Antarctic Intermediate Water appears on gamma-n=27.35 as 3 high Q
intrusions. Gamma-n = 27.74 has no local sources and crosses the oxygen minimum. Q is
beta-dominated.
|
|
|
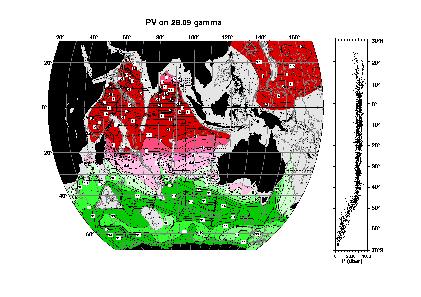
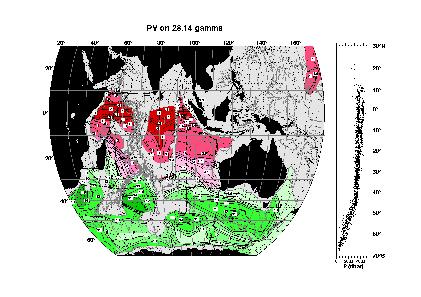
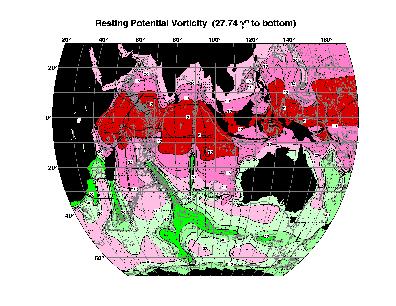
Deep Water. Bathymetric PV has highs over ridges, lows over basins. Deep layers do not
have this pattern. Gamma-n = 28.09 and 28.14 show Q altered by deep western
boundary currents entering basins. The low-high-low feature south of Australia is
bathymetric.
|
|
|
Bathymetric Q:

Conclusions
In the mid to high latitudes, source waters and their circulation set the upper ocean
potential vorticity structure outside the tropics. The abyssal PV structure is strongly
affected by both the abyssal circulation and topography. In the tropics, PV is dominated by
beta. In the transition region between the tropics and subtropics, PV has a somewhat higher
meridional gradient than in either region. The demarcation between the tropical and
subtropical regions likely results from a change in the efficiency of stretching. This
change in the nature of the PV field between the tropics and subtropics likely affects
planetary wave propagation characteristics.
For more information:
ltalley@ucsd.edu


