Cruise Report ONR
Japan/East Sea
Hydrographic survey
R/V Professor Khromov
KH38 28 February – March 17,
2000
Table of contents
A.4 List of principal investigators
A.5 List of cruise participants
B. Description of program and measurement
techniques
B.1 CTD (conductivity-temperature-depth)
B.2 Salinity water sample analyses
B.3 Oxygen water sample analyses
B.5 Alkalinity and pH analyses
B.6 Underway temperature, salinity,
chlorophyll
B.7 Lowered Acoustic Doppler Current Profiling
(LADCP)
Appendix A: CTD data quality comments
Appendix B: Station, rosette and
bottle data quality comments
A.1 Highlights
Expedition: KH38, Legs 1 and 2
Chief scientists:
Vyacheslav Lobanov
Pacific Oceanological Institute, Far Eastern Branch Russian Academy of Sciences
Vladivostok, Russia
email: lobanov@poi.dvo.ru
Lynne D. Talley
Scripps Institution of Oceanography, UCSD
La Jolla, CA
email: ltalley@ucsd.edu
Ship: R/V Professor Khromov, Captain I. Kiselev
Ports of Call:
Pusan,
Korea
Otaru,
Japan
a. Cruise track (Fig. 1)

b. Station sampling
81 (Leg 1 – 10; Leg 2 – 71) CTD/24-bottle
rosette stations with transmissometer and LADCP; sampling for temperature,
salinity, oxygen, nitrate, phosphate, silicate, nitrite, ammonium, pH,
alkalinity, CFCs. (1691 bottles)
CTD
station locations and times (WOCE Hydrographic Programme format)
KH38 Japan Sea
Professor Khromov 28 Feb 2000-17 Mar 2000 040700LDT
SHIP/CRS
CAST UTC EVENT
POSITION UNC HT ABOVE
EXPOCODE STNNBR CASTNO TYPE DATE TIME LATITUDE LONGITUDE DEPTH BOTTOM COMMENTS
-------------------------------------------------------------------------------------
90CIKH38/2
1
1 ROS 022800 1615 35 49.70
N 129 51.20 E
0
6 CTD#5
90CIKH38/2
2
1 ROS 022800 2130 35 51.30
N 130 33.50 E
0
7 CTD#5
90CIKH38/2
3
1 ROS 022900 225 36 2.80 N 131 5.30
E 0 5 CTD#5
90CIKH38/2
4
2 ROS 022900 709 36 28.90 N 131 13.30 E 0 7 CTD#5
90CIKH38/2
5
1 ROS 022900 1154 36 30.00
N 130 36.90 E
0
6 CTD#5
90CIKH38/2
6
1 ROS 022900 1610 36 30.00
N 130 2.90 E 0 6 CTD#5
90CIKH38/2
7
1 ROS 022900 1821 36 29.60
N 129 50.40 E
0
4 CTD#5
90CIKH38/2
8
1 ROS 022900 2246 37 3.20 N 129 55.80 E 0 3 CTD#5
90CIKH38/2
9
1 ROS 030100 209 37 4.00 N 130 17.30 E
2204
99 CTD#1
90CIKH38/2
10
1 ROS 030100 708 37 3.50 N 130 56.10 E
2214
5 CTD#5
90CIKH38/2
11
1 ROS 030300 216 38 20.00 N 130 0.30 E 608 7 CTD#5
90CIKH38/2
12
1 ROS 030300 546 38 40.00 N 130 22.10 E 2760 5 CTD#5
90CIKH38/2
13
1 ROS 030300 1027 38 59.80
N 130 43.20 E 3093 6 CTD#5
90CIKH38/2
14
1 ROS 030300 1505 39 17.10
N 131 2.00 E 3088 6 CTD#5
90CIKH38/2
15
1 ROS 030300 2033 39 39.80
N 131 27.50 E 3082 5
CTD#5
90CIKH38/2
16
1 ROS 030400 46 40 0.00 N 131 33.80 E
3056
5 CTD#5
90CIKH38/2
17
1 ROS 030400 510 40 19.90 N 131 33.90 E 3313 4 CTD#5
90CIKH38/2
18
1 ROS 030400 906 40 33.00 N 131 34.00 E 3324 5 CTD#5
90CIKH38/2
19
1 ROS 030400 1254 40 44.50
N 131 35.40 E 3324 6 CTD#5
90CIKH38/2
20
3 ROS 030500 23 40 58.60 N 131 33.40 E 3335 5 CTD#5
90CIKH38/2
21
1 ROS 030500 447 40 51.90 N 131 57.30 E 3375 5 CTD#5
90CIKH38/2
22
1 ROS 030500 858 40 45.30 N 132 20.50 E 3403 5 CTD#5
90CIKH38/2
23
1 ROS 030500 1301 40 59.60
N 132 19.70 E 3422 5 CTD#5
90CIKH38/2
24
1 ROS 030500 1703 41 15.00
N 132 23.10 E 3429 0 CTD#5
90CIKH38/2
25
1 ROS 030500 2142 41 15.90
N 131 59.20 E 3389 6 CTD#5
90CIKH38/2
26
1 ROS 030600 208 41 14.70 N 131 35.60 E 3342 5 CTD#5
90CIKH38/2
27
1 ROS 030600 640 41 34.90 N 131 35.00 E 3310 4 CTD#5
90CIKH38/2
28
1 ROS 030600 1912 42 32.80
N 131 35.70 E 73 5 CTD#5
90CIKH38/2
28
2 ROS 030600 2009 42 32.10
N 131 37.40 E 78 7 CTD#5
90CIKH38/2
29
1 ROS 030600 2315 42 27.30
N 131 36.60 E 124 7 CTD#5
90CIKH38/2
30
1 ROS 030700 116 42 23.00 N 131 36.40 E 747 13 CTD#5
90CIKH38/2
31
1 ROS 030700 532 42 21.20 N 131 36.40 E 1508 99 CTD#1
90CIKH38/2
32
1 ROS 030700 900 42 13.30 N 131 33.00 E 2808 99 CTD#1
90CIKH38/2
33
1 ROS 030700 1357 41 54.60
N 131 35.30 E 3137 6 CTD#1
90CIKH38/2
34
1 ROS 030700 2209 41 50.20
N 132 41.50 E 3412 21 CTD#1
90CIKH38/2
35
1 ROS 030800 445 42 14.20 N 132 45.00 E 3222 3 CTD#1
90CIKH38/2
36
1 ROS 030800 819 42 20.80 N 132 43.20 E 2972 99 CTD#1
90CIKH38/2
37
1 ROS 030800 1129 42 27.10
N 132 45.70 E 1608 4 CTD#1
90CIKH38/2
38
1 ROS 030800 1328 42 28.90
N 132 45.30 E 913 2 CTD#1
90CIKH38/2
39
2 ROS 030800 1556 42 32.90
N 132 46.00 E 133 6 CTD#1
90CIKH38/2
40
1 ROS 030800 2200 42 40.10
N 134 0.40 E 286 99 CTD#1
90CIKH38/2
41
1 ROS 030900 2356 42 35.40
N 134 0.50 E 1041 99 CTD#1
90CIKH38/2
42
1 ROS 030900 214 42 30.00 N 134 0.00 E 2237 6 CTD#1
90CIKH38/2
43
1 ROS 030900 544 42 19.90 N 134 2.10 E 3397 8 CTD#1
90CIKH38/2
44
1 ROS 030900 1019 42 4.70 N 133 58.40 E 3460 99 CTD#1
90CIKH38/2
45
1 ROS 030900 1447 41 50.00
N 133 59.70 E 3549 6 CTD#1
90CIKH38/2
46
1 ROS 030900 1941 41 29.80
N 134 0.30 E 3545 5 CTD#1
90CIKH38/2
47
1 ROS 031000 2359 41 14.50
N 134 2.20 E 3543 6 CTD#1
90CIKH38/2
48
1 ROS 031000 412 40 59.90 N 134 0.00 E 3535 3 CTD#1
90CIKH38/2
49
1 ROS 031000 900 40 46.00 N 134 2.40 E 3521 4 CTD#5
90CIKH38/2
50
1 ROS 031000 1324 40 30.00
N 134 0.10 E 3149 3 CTD#5
90CIKH38/2
51
1 ROS 031000 1646 40 20.00
N 133 59.80 E 2453 3 CTD#5
90CIKH38/2
52
1 ROS 031000 1924 40 10.30
N 134 0.30 E 1167 5 CTD#5
90CIKH38/2
53
1 ROS 031000 2133 40 0.50 N 134 0.20 E
1037
6 CTD#5
90CIKH38/2
54
1 ROS 031100 2353 39 50.00
N 134 0.00 E 556 5 CTD#5
90CIKH38/2
55
1 ROS 031100 443 40 6.10 N 134 50.50 E
1495
6 CTD#5
90CIKH38/2
56
1 ROS 031100 1116 40 53.30
N 135 19.70 E 3300 4 CTD#5
90CIKH38/2
57
1 ROS 031100 2005 41 40.10
N 136 19.70 E 3527 5 CTD#5
90CIKH38/2
58
1 ROS 031200 124 42 9.80 N 136 20.00 E
3645
5 CTD#5
90CIKH38/2
59
1 ROS 031200 642 42 35.10 N 136 19.80 E 3075 7 CTD#5
90CIKH38/2
60
1 ROS 031200 1143 42 46.90
N 136 0.10 E 3630 69 CTD#5
90CIKH38/2
61
1 ROS 031200 1841 42 57.60
N 135 39.30 E 3473 21 CTD#5
90CIKH38/2
62
1 ROS 031300 101 43 10.40 N 135 19.80 E 3429 6 CTD#5
90CIKH38/2
63
1 ROS 031300 402 43 14.40 N 135 14.80 E 1721 0 CTD#5
90CIKH38/2
64
1 ROS 031300 537 43 16.90 N 135 10.40 E 266 4 CTD#5
90CIKH38/2
65
2 ROS 031300 1701 43 59.90
N 137 59.60 E 2266 6 CTD#5
90CIKH38/2
66
1 ROS 031400 2322 44 25.70
N 137 49.90 E 2407 5 CTD#5
90CIKH38/2
67
1 ROS 031400 349 44 40.00 N 137 30.00 E 2006 5 CTD#5
90CIKH38/2
68
1 ROS 031400 640 44 47.80 N 137 17.00 E 1587 6 CTD#5
90CIKH38/2
69
1 ROS 031400 844 44 56.00 N 137 4.80 E 282 5 CTD#5
90CIKH38/2
70
1 ROS 031400 1524 45 31.30
N 138 27.90 E 1769 5 CTD#5
90CIKH38/2
71
2 ROS 031400 1939 45 49.20
N 137 59.80 E 163 4 CTD#5
90CIKH38/2
72
1 ROS 031500 52 46 38.00 N 138 40.00 E 135 5 CTD#5
90CIKH38/2
73
1 ROS 031500 209 46 33.00 N 138 50.00 E 471 5 CTD#5
90CIKH38/2
74
1 ROS 031500 344 46 28.80 N 138 59.70 E 1157 4 CTD#5
90CIKH38/2
75
1 ROS 031500 611 46 22.00 N 139 15.20 E 1539 5 CTD#5
90CIKH38/2
76
1 ROS 031500 841 46 15.00 N 139 30.70 E 1724 4 CTD#5
90CIKH38/2
77
1 ROS 031500 1200 46 12.00
N 139 59.90 E 1482 4 CTD#5
90CIKH38/2
78
2 ROS 031500 1512 46 8.10 N 140 30.40 E 1234 3 CTD#5
90CIKH38/2
79
1 ROS 031500 1818 46 5.00 N 141 0.00 E
596
6 CTD#5
90CIKH38/2
80
1 ROS 031500 2027 46 2.90 N 141 21.40 E 166 5 CTD#5
90CIKH38/2
81
1 ROS 031500 2157 46 1.00 N 141 36.50 E 101 6 CTD#5
c. Underway sampling
Meteorology
Surface temperature, salinity, fluorometry
d. Floats and drifters
1 K-SOLO optical drift profiler (Greg Mitchell, SIO). The K-SOLO will acquire temperature and
irradiance profiles at 5 m resolution in the upper 500 m. The spectral channels for irradiance
are at 412, 490 and 555 nm, corresponding to 3 of the channels on the SeaWiFS
ocean color satellite. Profiling
every second day.
A.3.a Introduction. The winter survey of the Japan/East Sea on the
Professor Khromov (Figure 1) was designed to sample the anticipated regions of
water mass transformation, and complements the summer cruises which covered the
same region as well as the Japanese sector and Ulleung Basin.
A principal
goal of the winter survey was to observe the maximum density and depth of
winter ventilation. Two separate processes were hypothesized: open ocean
convection and brine rejection through sea ice formation. Historical
hydrographic data suggests that ventilation reaching the bottom (>3500 m)
has not occurred since at least the 1930s. However, there is ample tracer
evidence of ventilation to intermediate depth. Intermediate depth convection,
as far as we know, had not been reported and possibly not observed.
The winter-time
atmospheric pattern that is most important for convection is the cold air
outbreaks in which cold Siberian air funnels past Vladivostok out across Peter
the Great Bay and then southward out into the JES. Winter 99-00 was probably a
season of especially strong cold air outbreaks. (A comparison with other years
is underway.)
Sea ice forms
in Tatar Strait, down along the Russian coastline, and in Peter the Great Bay
(at Vladivostok). The sea ice extent in late February, 2000 at the start of the
cruise is shown in Figure 2 from the National Ice
Center (NOAA). The winter of 1999-2000 was a year for especially heavy ice,
compared with the preceding three years, and anecdotally. A comparison with the
historical record is underway. Since the ocean circulation is cyclonic north of
the subpolar front, with the Liman current flowing southward along the Russian
coast, it was expected to find outflow from the ice formation heading westward
along the coast.
In the previous winter (April, 1999) a Russian cruise on the
Gordienko (Lobanov, chief scientist) observed dense water in pockets on the
shelf in Peter the Great Bay and down along the slope, suggesting flow down
canyons on the shelf, turning westward.
A.3.b.
Winter conditions prior to the Professor Khromov winter survey. Just prior to the
winter,2000 survey, we assessed the most likely locations for convection.
Vertical temperature and salinity profiles from the profiling floats were
accessed from Steve Riser's webpage. Satellite AVHRR images were accessed from
three sources: the Pacific Oceanological Institute in Vladivostok (Lobanov),
Bob Arnone's webpage, and KORDI.
The floats
profile to 800 meters depth. Two floats (numbers 230 and 262) of the total of
about 38 showed nearly uniform properties to 800 m in February (Figure 3). Float 230 began record
well-mixed water in mid-January, south of Peter the Great Bay. As it was
advected southward, the profiles remained well mixed until the end of February.
The actual numbers are not yet available to us, and so we cannot judge how well
mixed the water was, but in February it appeared to be nearly uniform in
temperature to the 800 m maximum depth of the profiles. Just at the beginning
of March, the time of the Khromov survey, the JES warmed prematurely compared
with previous years (based on satellite SST images); float 230 then began
recording increasingly stratified water. Float 262, in the same region as 230,
also showed nearly mixed water throughout February.
Two floats (258
and 223) in Tatar Strait (northern JES) also showed relatively mixed water in
February, but did not show layers deeper than about 300 m (based on
subjectively leafing through the profiles on the webpage).
SST images from
the JES in February, 2000, ( Figure 4a from Bob Arnone at NRL)
showed a large, warm, anticyclonic eddy centered at about 41N, 131E, with a
diameter of about 100 km. Just east of the warm eddy was the location of the
profiling floats showing well-mixed water. Surface temperatures in this region
were cold, and contiguous with cold waters to the north. By the time of the
hydrographic survey, the warm portion of the eddy had spread eastward, with an
eastern edge around 132E ( Figure 4b also from Bob Arnone at
NRL). This eddy is a common feature of this region.
Sea ice just at
the start of the cruise (Figure 2) was at its maximum
extent for the winter, and was at a somewhat greater extent than in the
previous several years. A sudden warming occurred at the beginning of March,
and by the next week, when the Khromov entered the ice-covered areas, most of
the ice had melted; none was encountered.
A.3.c
Winter cruise and evidence of ventilation. The Khromov sailed from
Pusan, Korea on February 28, 2000, for a three day shakedown cruise of 10
stations in the Ulleung Basin, after which the American and Korean participants
disembarked in Pusan. The Khromov then completed a 13-day survey of the central
and northern JES, with 71 stations (Figure 1). At each station, the CTD/transmissometer/24-bottle rosette
package was deployed. An altimeter on the rosette frame allowed each station to
be occupied to within 10 meters of the ocean bottom. Two separate rosettes were
used on the cruise - a large package (24 10-liter bottles and CTD) deployed
from the fantail, and a small package (24 1.7-liter bottles and CTD) deployed
from the port side. The smaller package was used during rough weather (stations
31-48).
The weather was
calm during the shakedown cruise. During the main cruise, very rough weather
was encountered several times. Air temperatures dropped well below freezing,
causing difficulties with rosette sampling at several stations, particularly
since it was necessary to use the rosette with the small volume bottles at
these stations.
Evidence of
winter ventilation was obtained at three sites:
(1)
intermediate depth (~1000 m) convection east of the warm eddy, at the location
of the most well-mixed profiles observed by the floats in February and
southernmost penetration of cold SST,
(2) mixing
to 360 m in the northern Japan Sea,
(3) shelf
water on the continental slope just south of Peter the Great Bay.
These are
discussed sequentially in the next paragraphs.
(1) Intermediate
depth open ocean convection was evident in oxygen, temperature and salinity
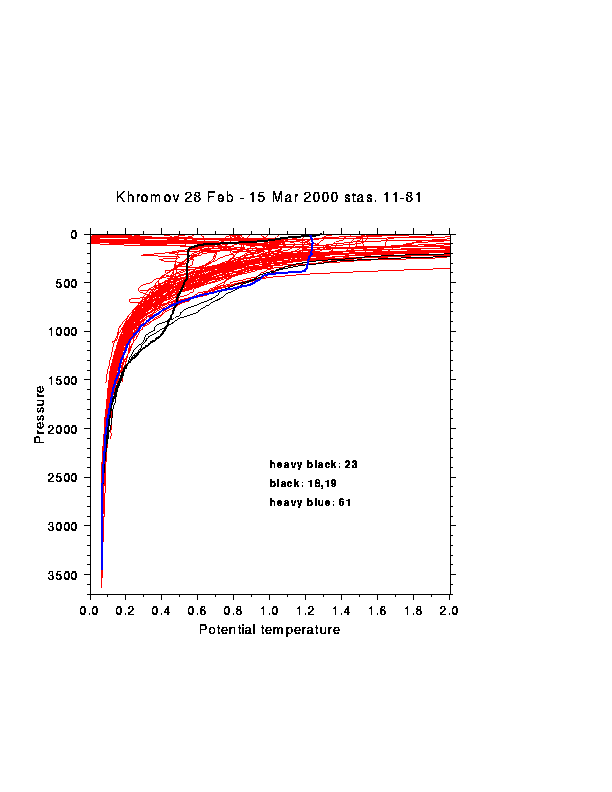
profiles at four stations south of Vladivostok, near 41N, 132E (stations 18, 19
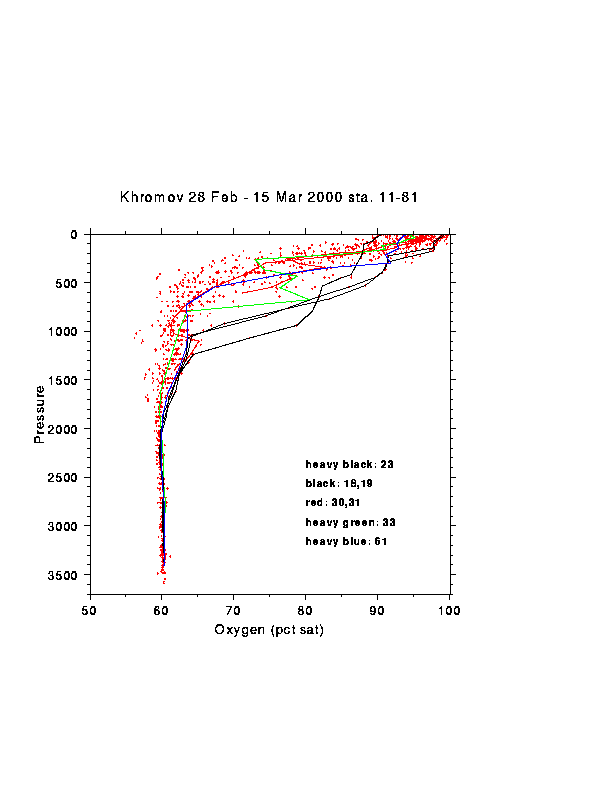
and 23). Station 23 (41 0'N, 132 20'E) showed the deepest penetration of oxygen
saturation greater than 80% (Figure 5), suggesting that
convection had reached to about 1040 dbar. A vertical section of oxygen along
131E, with a deviation through station 23, also shows the depth of this high
oxygen layer (Figure 6). Despite the location
of several stations in the region that was being sampled by the profiling
floats 230 and 262, only this station showed penetration of high oxygen to
greater than 800 m. The temperature and salinity structure at station 23
includes two separate layers that could have been well-mixed. Oxygen saturation
at station 23 (and also adjoining stations 20 and 21) is quite low at the sea
surface, at about 90%, and then relatively homogeneous below dropping to 80%
only below 1100 m. The low surface saturations could be a signature of vigorous
vertical mixing. The only other station in the survey with low surface oxygen
was station 34, in the open sea south of Vladivostok.
The history of
the profiling floats, the relatively low surface oxygen saturation, the depth
of penetration of surface oxygen values, and the relative homogeneity of
properties in two thick layers at station 23 suggest that convection occurred
to about 1100 m depth in February in this region. The disappearance of coldest
SST in this region at the end of February, and the lack of observation of truly
homogeneous temperature/salinity, suggests that collapse of the homogeneous
layer in the absence of continued forcing was very rapid, on the order of less
than one or two weeks.
The implied
maximum density of surface convection at station 23 is 27.329 sigma theta,
32.034 sigma 1, although the data are not yet well calibrated.
(2) In the
northern Japan Sea, just east of the Liman Current and winter ice edge, a
well-mixed surface layer of 360 m thickness was found (station 61 at 42 58'N,
135 39'E - Figure 7), with oxygen saturation greater than 90% ( Figure 5 ). This station was
near the location of profiling floats that showed relatively uniform surface
layers of about this depth in February. No other stations had mixed layers (in
temperature) this deep although many stations in the region showed 200 m thick
mixed layers.
Based on oxygen
saturation, there is an axis of winter mixed layers of 250 to perhaps 400
meters thick just offshore of the 3000 meter isobath. Station 61 fits within
this group, as does station 34 and 33, both of which showed relatively deep
high oxygen layers. These depths differ considerably from the apparent deep
overturn to 1100 m described in (1).
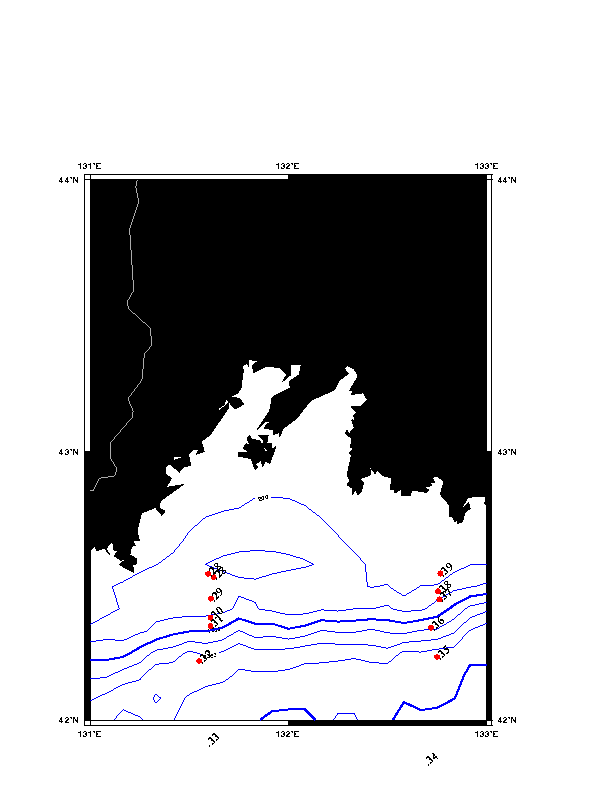
(3) High oxygen
saturation is found on the bottom at two stations (30 and 31 - Figure 5) on the continental
slope just south of Peter the Great Bay ( Figure 1b). The station depths
were 600 and 1400 meters. The high oxygen subsurface layers were about 200-300
meters thick. These layers likely originate from the shelf based on similar
observations in April, 1999. The oxygen layer at the deeper station is not
highly saturated and in fact fits well with the curve of higher saturations
from the intermediate convection stations. This leaves open the possibility
that this ventilated water originates from offshore convection and that the
vertical profile is a composite of older and newly-ventilated waters, with the
newest water found at the bottom.
A.4 List of principal investigators
- Vyacheslav
Lobanov (POI), Lynne Talley (SIO), Vladimir Ponamarev (POI), Igor Zhabin
(POI), Alexander Nadashkovskiy (POI): Temperature, salinity, oxygen,
nutrients (CTD and rosette)
- Nikolay
Rykov (FERHRI), Lynne Talley (SIO) and Peter Hacker (UH): Lowered Acoustic
Doppler Current Profiling
- Pavel
Tishchenko (POI): Alkalinity, pH
- Kyung-Ryul
Kim (SNU): Underway T/S/chlorophyll
- Greg
Mitchell (SIO): optical profiling float
- Igor
Filippov (FERHRI) and Robert Beardsley (WHOI): meteorology
A.5 List of cruise participants
Leg 1 only
Lynne Talley (SIO) - Chief scientist
Carl Mattson (SIO/ODF) - Electronics/Deck watch
Doug Masten (SIO/ODF) - Nutrient analyst/data processing
Bob Williams (SIO/ODF) - Oxygen/Bottle data
Scott Hiller (SIO/ODF) - Electronics/Deck watch
Dong-Jin Kang (SNU) - underway chemistry, CO2 (pH by
spectro.)
Doshik Hahm (SNU) - CO2 (pH by spectro.)
Leg 2 only
Vyacheslav Lobanov (POI) – Chief scientist
Legs 1 and 2
Alexey Sherbinin (FERHRI) Technician in charge
Sergey Yaroshev (FERHRI) Deck
Mikhail Danchenkov (FERHRI) Float deployment
I. Filippov (FERHRI) Meteorology
K. Zhevrov (FERHRI) Salinity
A. Sevastyarov (FERHRI) PLT
Anatoly Lemecha (FERHRI) Deck
Alexander Nedashkovskiy (POI) - Nutrients
Sergey Sagalaev (POI) - Oxygen
Michael Gorelkin (FERHRI) - Salinity
Igor Titov (FERHRI)
- Electronics, Deck watch
Vladimir Luchin (FERHRI) - CTD/rosette operations, CTD console
Nikolay Rykov (FERHRI) - CTD/rosette operations
Vladimir Kraynev (FERHRI) - CTD/rosette operations
Igor Zhabin (POI) -
CTD/hydrographic data management, software, processing,Deck
Vladimir Ponamarev (POI)- CTD/hydrographic data management,
software, processing
Pavel Tischenko (POI) - POI chemistry head, CO2 (pH by EMF)
Ruslan Chichkin (POI) - CO2 (pH by EMF)
Elena Ilyina (POI) - CO2 (Alkalinity)
Maria Shvetsova (POI) - CO2 (Alkalinity)
Sergei Zakharkov (POI) - Bio-optics
Andrey Shcherbina (SIO) LADCP
Galina Pavlova (POI) CO2
Galina Volkova (POI) CO2
Olga Shevtsova (POI) Co2
Yuri Shulga (POI) Co2
A Kalyagin (POI) noble gases
Institution acronyms
B.
Description of program and measurement techniques
B.1 CTD (conductivity-temperature-depth):
B.1.a Shipboard configurations: Carl Mattson (SIO/ODF)
CTD data were recorded on IBM PC's. Digital backups on CDROMS and Zip disks. Analog backups on VCR cassettes.
CTDs used:
NBIS Model MKIII ODF CTD#1 sta 9 (leg 1), stations 31-48 (leg 2)
NBIS Model MKIII ODF CTD#5 sta 1-8,10 (leg 1), stations 11-30, 49-81 (leg 2)
Large Rosette (24-place, 10 liter bottles): Stations 1-8,
10-30, 49-81.
- NBIS MKIIIB CTD s/n 01-1070 (ODF CTD#5)
- Pressure s/n 77017
- Temperature 1 (T1): s/n 15407
- Temperature 2 (T2): s/n 17534
- Conductivity 1 (C1): s/n P42
- Conductivity 2 (C2): s/n O24
- Sensormedics Oxygen Sensor s/n 90222-03 (stations 1-8, 10-30, 49-58?)
- Sensormedics Oxygen Sensor s/n unknown (stations 59-81)
- STS 24 bottle rosette frame
- 24pl Seabird pylon model SBE32 s/n 3212613-0164
- SIO made Bullister style 10 liter bottles
- Simrad Altimeter model 807 s/n 9711091
- STS Battery Pack for Altimeter
- Wetlabs Cstar 25cm (Blue) Transmissometer s/n CST-244DB
- Wetlabs Cstar 25cm (Red) Transmissometer s/n CST-245DB
CTD#5: CTD #5 has dual temperature/conductivity sensors mounted on twin turrets - two identical temperature channels and two identical conductivity channels. CTD sensors were soaked in distilled water between all casts. The T1C1 pair of sensors was used for shipboard processing. The T2C2 pair was used for final processing (section B.1.b below).
Bottles: 10L Bullister style SIO manufactured. Bottles serial numbered 1-24 corresponded to the pylon tripping sequence 1-24 with the first bottle tripped being bottle #1. Bottles serial numbered 1-24 were used on all casts.
Oxygen and transmissometer were interfaced with the CTD and incorporated into the CTD data stream.
No reversing thermometers, no pinger.
Small Rosette (24-place, 2.7 liter bottles): Stations 9,
31-48.
- NBIS MKIIIB CTD s/n 01-2809-01 (ODF CTD#1)
- Pressure s/n 130538
- Temperature: s/n 13661
- Conductivity: s/n F143
- Sensormedics Oxygen Sensor s/n 90423-04 (:not working on sta. 42)
- STS small 24 bottle rosette frame
- 36pl Seabird pylon model SBE32 s/n 0113
- 24 SIO made bullister style 2.7 liter bottles
- Benthos Altimeter model 2110 s/n 156
CTD sensors were soaked in distilled water between all casts.
Bottles: 2.7L Bullister style SIO manufactured. Bottles serial numbered 1-24 were tripped in sequence. The pylon was a SBE32 36 place model so certain pylon positions were skipped. This was done automatically by the acquisition program and tripped in the following order.
01 02 04 05 06 08 10 11 13 14
16 17 19 20 22 23 25 26 28 29
31 32 34 35
Oxygen data were interfaced with the CTD and incorporated into the CTD data stream.
No reversing thermometers, no transmissometer, no LADCP, no pinger.
Winches: The CTD winch had a 9mm single conductor EM cable with approx 4500M of wire at beginning of cruise.
B.1.b CTD final calibrations: Mary Johnson (SIO/ODF) (10
June 2005)
General comments: These KH38 CTD data are final. All interpolated/extrapolated data are quality-coded 6 and documented in "kh38CTD_Cmmts" (Appendix A). Oxygen corrections are from a preliminary pass over the data and fits have not been optimized. CTD oxygen data have been included as a courtesy: they are reported and coded 1 (uncalibrated), or NOT reported and coded 5 (for casts where there was a known problem with the sensor, noted in "kh38CTD_Cmmts" in Appendix A).
Despiked/offset or interpolated/extrapolated data are quality coded 7 or 6, respectively, in the data files. A preliminary WOCE ".sum" file was generated from a positions file that came off the ship with the data. No further checking/editing was done, other than to add the "HT ABOVE BOTTOM" values that were already machine-readable.
CTD-1 was used for the stations 9 and 31-48. CTD-5 (with dual T/C sensors) was used for the remainder of the stations 1-81. Downcast data were used for all but 9 casts for final pressure-series data; exceptions are noted in the file "kh38CTD_Cmmts" (Appendix B).
The CTD-5 secondary T/C sensors were used as the "better" pair; both sensor pairs had problems with noise and offsets. There was only one conductivity sensor on CTD-1, so the primary T/C sensors were used for those data. Calibrated pressure-series CTD data appear to be consistent from cast-to-cast, on overlays of deep theta-salinity profiles plus surface salinity and sigma theta plots vs. pressure. Most bottle salinity data are fairly well centered over the CTD data on the deep theta-salinity plots. A few bottle salinity values need to be quality-coded 3; they were ignored while determining final CTD conductivity corrections.
Calibration specifics:
CTD#5 (stations 1-8, 10-30, 49-81)
Pressure Sensor s/n 77017 (Paine):
P Calibs:
Jan. 2000 - 0.14/15.25 deg.C bath to 6080/1191 db
Apr. 2000 - -1.32/16.61 deg.C bath to 6080/1191 db
cold cal: shifted +0.1(dn),+0.25(up)/+0.3-.4/+0.5 db 0db/mid-range/4000db
from pre- to post-cruise calibration
warm cal: shifted -0.5-.4/-0.3-0/+0.2 top 1000db/mid-range/bottom
Correction used: average pre-/post-cruise cold calibrations and warm calibrations (pre-cruise significantly smoother, but slope changed).
Temperature Sensor s/n 17534 (Rosemount PRT) ("T2"):
T Calibs: Jan. 2000/Apr. 2000
+0.0029/+0.0017/+0.0014/+0.0023 at -1.5/3.5/8.5/15.5 deg.C
from pre- to post-cruise calibration
Correction used: equally weighted Jan. + Apr. 2000 Tcals (same #pts at each level, same # of levels) - then averaged, calculated second-order fit of differences to raw T. (Not possible to tell when +0.0015 to +0.003 deg.C correction shift occurred; averaging two calibrations should put all temperature values within +/-0.0015 deg.C error range.)
Conductivity Sensor s/n O24 (GO) ("C2"):
Calibrated to bottle salts taken during cruise.
1. Checked dC(C) fits for all bottle differences/all CTD-5 stations together; determined first-order dC(C) fit worked best to optimize corrections for deeper data points. Some cast-to-cast shifts noted, as well as a few stations with more "flyer" differences than others. The first few stations (CTD-5) had much larger CTD offsets from cast to cast on deep theta-salinity plots using the same conductivity slope/offset for all casts. Deep bottle data were fairly consistent for these same early casts.
2. First-order dC(C) fits with a (4,2) std.dev. rejection were generated for each cast from Bottle-CTD Cond. differences, then the slopes were compared (disregarding any offset differences). Stations with a conductivity range < 2 mS/cm or with a disproportionate number of "flyers" in high-gradient areas were omitted for the next step.
3. The slopes from step 2 were smoothed in 2 groups: a first-order fit through the slopes for stations 1-30 , as a function of station number (time), was determined, then applied as smoothed/slowly decreasing dC(C) slopes for stations 1-20. The slopes seemed to stabilize at that point (perhaps because the conductivity range within each cast decreased substantially by station 20). An average of the slopes for stations 17-79 was determined and applied to conductivities for stations 21-81. The two sets of slopes transitioned quite smoothly at stations 20/21.
4. Residual conductivity offsets from step 3 were calculated for data deeper than 250db. Smoothed offsets were determined in two groups (as expected, since the slopes were two groups). A second-order fit of residual conductivity offsets deeper than 250db, as a function of station number (time), was determined for stations 1-21 and applied to stations 1-20. This pulled the earlier stations in much better than a first-order fit would have, and matched up well with the next group. A first-order fit of residual 250db+ conductivity offsets, as a function of station number (time), was determined using stations 21-23 and 49-79 (minus two casts outside the (4,2) std.dev. rejection range). The smoothed offsets were then applied to stations 21-30 and 49-81.
5. Offsets were then manually adjusted from the smoothed values based on deep theta-salinity consistency. Several Autosal runs were disregarded because of standardization issues caused by instrument problems and drifts, especially on earlier stations.
6. A small residual pressure-dependent slope was apparent at this point. First- and second-order dC(P) fits for all residual conductivity differences, with (4,2) std.dev. rejections applied, were compared. The two fits were similar, but the second-order fit was used because it had less effect on the deep data while pulling in the surface data about the same amount. The dC(P**2) and dC(C) coefficients were both used, combining the two offsets.
CTD#1 (stations 9, 31-48):
Pressure Sensor s/n 130538 (Paine):
P Calibs:
Jan. 2000 - -1.47/0.13/15.66 deg.C bath to 6080/1191 db
Apr. 2000 - -1.33/16.60 deg.C bath to 6080/1191 db
first Jan. cold calib disregarded: CTD repaired between 2 cold cals
(very different slope/offset than next calibration done)
cold cals: shifted -0.1/0/+0.2 db top 1000db/mid-range/3000db-btm +
upcast from pre- to post-cruise calibration
warm cals: shifted maximum +0.2 db from pre- to post-cruise calibration
Correction used: average pre-/post-cruise cold calibs and warm calibs (omitted noisy data where 200psi weight removed on Apr. cold upcast)
Temperature Sensor s/n 13661 (Rosemount PRT):
T Calibs: Jan. 2000/Apr. 2000
+0.0006 at -1.5 deg.C, +0.00045 at 5.0 deg.C and +0.0013 at 16.0 deg.C
Correction used: equally weighted Jan. + Apr. 2000 Tcals (same #pts at each level, same # of levels) - then averaged, calculated second-order fit of differences to rawT
Conductivity Sensor s/n F143 (NBIS):
Calibrated to bottle salts taken during cruise.
NOTE: This sensor had a small + Conductivity drift with time during its first cast (station 9). The drift seemed to have stabilized by the bottom of the downcast. Since the downcast data clearly required a different correction, the upcast was used for pressure-sequencing to get a better-calibrated cast.
1. Checked dC(C) fits for all bottle differences/all CTD-1 stations together; determined first-order dC(C) fit worked best to optimize corrections for deeper data points. Some cast-to-cast shifts were noted, especially station 9 being substantially lower than the rest.
2. First-order dC(C) fits with a (4,2) std.dev. rejection were generated for each cast from Bottle-CTD Cond. differences, and the resulting slopes were compared (disregarding any offset differences). The slopes were smoothed in 1 group with a first-order fit through the slopes for stations 9 and 31-48, as a function of station number (time), minus a few very shallow casts or casts with several "flyers" in gradient areas. Smoothed/slowly decreasing dC(C) slopes were applied to stations 9 and 31-48.
3. Residual conductivity offsets from step 2 were calculated for data deeper than 250db. Smoothed offsets were determined in one group: a first-order fit of residual 250db+ conductivity offsets for stations 34-48 (minus shallower stations 38-40) was determined, then applied to stations 31-48. Station 9 was offset separately, not surprising because of its drifting problem on the downcast.
4. Offsets were then manually adjusted from the smoothed values based on deep theta-salinity consistency. Stations 31-33 needed a bigger adjustment than most, probably due to the long period of non-use between stas 9 and 31. More than a typical amount of fine-tuning was needed for these casts, where the CTD was subjected to some exceptionally cold temperatures and more than its share of frozen sensor issues.
5. The residual offsets were checked for any pressure-dependent correction, and none was warranted.
Both CTDs together - final conductivity calibration
checks:
Deep Theta-Salinity overlays of 8 consecutive casts, as well as non-consecutive stations in close proximity to each other based on position and/or depth, were checked for consistency. Data were also checked against deep areas of KH36 casts at the same positions (from a July-August 1999, in a warmer season), and a few more small offset adjustments were made. KH38 deep data lie within 0 to +0.001 mS/cm of KH36 deep data at similar station positions throughout the cruise area.
In Jan. 2005, Young-Gyu Park (khoh@kordi.re.kr) emailed concerns about a large (0.007 PSU) difference between J04 and J07 deep salinity data. He sent theta-salinity plots of J04 data and preliminary J07 data he had acquired from Lynne Talley's website. After finalizing conductivity corrections, KH38 data (aka J07), stations 1-10, were re-checked against the J04 plot: the inconsistencies have disappeared, and the deep theta-salinity data now agree to within 0.001 PSU.
CTD Oxygen data:
Preliminary automated fits from 2002 were applied to the data; no individual attention was given to resolve specific fitting problems. The CTD oxygen data were reported as "uncalibrated" in the final WOCE-format CTD data files. An attempt was made to determine where the sensors had failed; these CTD oxygen data were not reported. (Exception: a few casts' fits were SO bad that huge negative oxygen values appeared in the data files and caused a problem in file checking/generation. Corrections from a nearby cast were used instead to bring these data into the ballpark; these casts are documented in kh38CTD_Cmmts, Appendix B.)
CTD Transmissometer data:
Time-series data files with preliminary block-averaged data, including both transmissometers, were given electronically to Margaret Stramska (USC and UCSD email addresses) in Nov. 2002. They were not further processed by ODF, and are not included with this data set.
B.2 Salinity water sample analyses: Carl
Mattson (SIO/ODF)
Salinometer types Serial
numbers Stations Bath
temperature
Guidline 8400A Autosal 57-396 6-81 24°C
Guidline 8400A Autosal 48-263 1-4 24°C
Standard seawater:
Batch P-134
The autosals were configured for computer-aided measurement.
The data was acquired on a PC during analysis.
On station 5 there was a problem with the Autosal. Complete comments on the quality of
individual salinity water samples are given in Appendix B.
B.3 Oxygen water sample analyses: Carl
Mattson (SIO/ODF)
Oxygen water samples were run on all stations using a
Dosimat UV-endpoint detection automatic titration system. The titrator employed a Brinkman
Dosimat 665 automatic burette and an Ultraviolet detection system interfaced
with a PC for data acquisition and control.
Comments on the quality of individual oxygen water samples
are given in Appendix B.
B.4 Nutrient analyses: Carl Mattson
(SIO/ODF)
Nutrients were run on all stations using a Technicon AA-II
CFA system with a PC based acquisition system. Nutrients measured - NO2, NO3,
PO4, SIO3 and also ammonium. The
system performed well with few problems. Data was reviewed by analysts and
transferred to the processing computer for integration with other water sample data.
Comments on the quality of individual oxygen water samples
are given in Appendix B.
B.5 Alkalinity and pH analyses: Pavel
Tishchenko (POI)
Samples were collected and analyzed for pH and alkalinity
from every station. Methods are
described in the cruise reports from the R/V Revelle (HNRO7) (website http://sam.ucsd.edu/onr_data/j04/hnro7_revelle_report.htm)
and R/V Professor Khromov (KH36) (website http://sam.ucsd.edu/onr_data/j05/kh36_khromov_report.htm),
both conducted in summer 1999 as part of the same project.
Comments on the quality of individual water samples are
given in Appendix B.
B.6 Underway temperature, salinity,
chlorophyll: Dong-Jin Kang and Doshik Hahm (SNU)
Salinity, temperature, and chlorophyll fluorescence were
measured every minute. the
thermosalinograph was a with Seabird (SBE 21) with two temperature sensors and
conductivity sensor, all calibrated in late April 1999. Fluorometry was measured with a Wet
Labs WETStar fluorometer, calibrated June 5, 1999. GPS navigation was recorded every minute.
B.7 Lowered Acoustic Doppler Current
Profiling (LADCP): Lynne Talley (SIO) and Peter Hacker (U. Hawaii)
A 150 KHz RD Instruments acoustic doppler current profiler
was integrated with the large CTD/rosette package. The LADCP makes direct
current measurements at the depth of the CTD, thus providing a full profile of
velocity. The LADCP was used at every station with the large rosette package
(Stations 1-8, 10-30, 49-81). The
shipboard data acquisition system for the LADCP permits data acquisition on a
laptop PC and very preliminary processing on a small Sparc workstation.
B.8 Meteorology: Robert Beardsley and
Richard Limeburner (WHOI)
Overall information about the
shipboard meteorological measurements for the Japan Sea cruises is available on
the website http://www.whoi.edu/science/PO/japan_sea. The complete report for KH38 is on the
website http://www.whoi.edu/science/PO/japan_sea/japan2000khromovcrpt/crurptkhromov00.htm.
The following two paragraphs
are taken from the introduction to that report.
"The objectives of the meteorological component of the
2000 winter hydrographic cruise on the R/V Professor Khromov to the Sea of Japan were to make high quality
shipboard measurements of wind speed and direction, barometric pressure,
relative humidity, air temperature, sea surface temperature, short wave
radiation, long wave radiation and precipitation.
The meteorological equipment was shipped to Korea in January
2000 and the instruments were then mounted on the Russian ship in Pusan. This
report describes the instruments used during the cruise and the data collected.
R. Limeburner from WHOI installed the meteorological
instruments on the ship in Pusan, Korea and Alexey Sherebinin and Igor Filippov
from the Far Eastern Regional Hydromet Research Institute, Vladivostok assisted
in the installation."
B.9 Navigation: Robert Beardsley and
Richard Limeburner (WHOI)
GPS data were collected by Woods Hole Oceanographic
Institution (Beardsley and Limeburner) at 10 minute intervals for the entire
cruise. See the report linked in
B.8 for information and data.
Appendix
A: CTD data quality comments (M. C. Johnson SIO/ODF)
kh38CTD_Cmmts (Mary C. Johnson, June 2005)
## Comments, (console logs,
winch stops (2 mins. or longer), yoyos over 10db, etc.)
* pressure-series starts from top of
(last) yoyo to surface
sta/cst Comment
004/01 apparently ABORTED: cast started "with oxygen cup" -
cast not reported
004/02 noisy ctdoxy data vs stas 3/5 (perhaps oxy sensor cover still
not removed?)
004/02 7-min. stop at
76 - 80 db
009/01 small rosette/ctd-1; first use ctd-1, large C drift,
especially on downcast: use up
020/01 apparently ABORTED: no console log - cast not reported
020/02 apparently ABORTED: no console log - cast not reported
020/03 cast started in-water at 3db
028/01 wind 17 m/sec; all bottles open due to freezing; DU confirmed
ok; unstable surface
028/01 -0.008 PSU top
22db and no 0-2db, suspect partially frozen start of down: use up
028/02 cast 2 after rosette warmed up/checked; frozen sensors at
start, no usable 0-4db
028/02 down: use up; wind 17-19 m/sec;
4.5-mins. at 0 - 16 db (up)
029/01 wind 17.5 m/sec; frozen sensors at start: 18db yoyo (20.5db
back to surface down),
029/01 still see
instabilities second time down: use up
030/01 wind 19.2-20 m/sec
031/01 strong wind (18-19 m/sec) and waves: Change to small
rosette/ctd-1; data file incomplete:
031/01 cast replayed
from tape, but tape apparently jammed at cast start, lost top 52db (down)
032/01 rawP jump going in/fast, perhaps slightly frozen, but ok
before starts down.
033/01 27db yoyo (818.5db back to 791.5db down, 2-min. delay)
034/01 used full cable length (? not sure of writing); wind 14.9
m/sec; cast started in-water
034/01 at 2db in, noise
and dropouts; frozen P sensor, prs bad 25-132db down: use up;
034/01 up has a few
7-sec. gaps
034/01 2.5-min. stop at
2 - 6 db (up)
039/01 apparently ABORTED: "trouble [with] pressure sensor"
039/02 2 yoyos back to surface (from 31.7db, then 88.8db down)*;
trips on last/full upcast
040/01 3.5-min. stop at 0 - 4 db
041/01 wind 11.9 m/sec
042/01 wind 10.1 m/sec;
043/01 wind 12.7 m/sec; frozen P sensor, pressure bad 96-190db down:
use up
044/01 13.5db/14db yoyos (1712.0db back to 1725.6db up/1169.6db back
to 1183.8db up);
044/01 frozen P sensor,
pressure bad 35-84db down: use up
046/01 wind 11.8 m/sec; frozen P sensor, pressure bad 26-110db down:
use up
047/01 wind 12.2 m/sec; 9.5-min. stop at 0 - 6 db/surface
048/01 wind 6.8 m/sec; 8-min. stop at 0 - 6 db/surface
049/01 back to large rosette/ctd-5; 30.5-min. stop at 548 - 554 db
052/01 cast started in-water at 17db; 14db yoyo (17.8db back to 3.7db
down)*
053/01 wind 2.8; Yamato Rise, station between two mounts
054/01 wind 1.9; top of Yamato Rise
055/01 wind 4.9 m/sec; center of eddy; "set time at the GPS
PC"
057/01 cast started in-water at 7db, back to surface before starting
down
059/01 ctdoxy sensor replaced before cast; 13db yoyo (16.6db back to
3.8db down)*
060/01 wind 18 to 10.5 m/sec; cable length too short to reach btm
layer;
060/01 (wire angle?)
consisted of 45-50 degrees; cable 'deformation'
060/01 due to strong
wind and current near the Bosorov Rise
061/01 50m cable cut off prior to sta 61 due to cable deformation on
sta 60;
061/01 full cable
length used due to strong wind drift: wind 12.3 -14.6 m/sec;
061/01 R/V drift approx.
6m(iles?)
062/01 wind 8 m/sec; Pressure sensor "did not work fine on deck
(freezing?)"; frozen
062/01 C sensor at
surface, yoyo to thaw: 17db yoyo (21.8db back to 4.5db down)*
063/01 echosounder depths noisy, did not go near bottom over
rough/strong canyon slope
065/01 apparently ABORTED: no console log - cast not reported
065/02 (big Russian word, then "at 06502"); 82-sec gap in
raw data at 4db
066/01 wind 12.5 m/sec
067/01 wind 7.5 m/sec
070/01 14.5db yoyo (1533.9db back to 1519.4db down, 5-min. delay)
071/01 apparently ABORTED; wind 10.5 m/sec; P, C, ctdoxy sensors did
not work due to
071/01 freezing, T
sensors show above freezing - incorrect; rosette brought back
071/01 aboard and
warmed with warm water before c.2
071/02 wind 10.5 m/sec
073/01 wind 0.8 m/sec
075/01 wind 5 m/sec
078/01 apparently ABORTED: "there are [not] any data in cast
1" - cast not reported
079/01 wind 2.2 m/sec
080/01 wind
7.4 m/sec
081/01 cast started in-water at 3db
## Upcasts used for pressure-sequencing:
sta/cst Reason for using upcast data
009/01 Conductivity drift on downcast, settled out by cast bottom.
028/01 Frozen T/C sensor problems on downcast
028/02 Frozen T/C sensor problems on downcast
029/01 Frozen T/C sensor problems on downcast
031/01 Top 52db of downcast data missing from raw data file and
backup tape
034/01 Frozen P sensor, pressure appears to stabilize 132db down
043/01 Frozen P sensor, pressure appears to stabilize 190db down
044/01 Frozen P sensor, pressure appears to stabilize 84db down
046/01 Frozen P sensor, pressure appears to stabilize 110db down
## Pressure levels interpolated (missing data, or
omitted instabilities at surface):
(total
61 levels interpolated in 50/82 casts)
sta/cst pressures sta/cst pressures
004/02 0 db 048/01 0-2,154,444 db
008/01 0 db 049/01 0 db
017/01 0 db 050/01 0 db
019/01 0 db 052/01 0-2 db
021/01 0 db 056/01 0 db
023/01 0 db 057/01 0 db
024/01 0 db 059/01 0-2 db
025/01 0 db 061/01 0 db
026/01 0 db 062/01 0-2 db
027/01 0 db 063/01 0 db
029/01 0 db 064/01 0 db
030/01 0 db 065/02 0 db
033/01 0 db 067/01 0 db
034/01 3110-3112 db 069/01 0 db
035/01 0 db 071/02 0 db
036/01 0 db 072/01 0 db
037/01 0-2 db 073/01 0 db
038/01 0 db 074/01 0 db
039/02 0 db 075/01 0 db
040/01 0-2 db 076/01 0 db
041/01 0 db 077/01 0 db
042/01 0-2 db 078/02 0 db
044/01 0 db 079/01 0 db
045/01 0 db 080/01 0 db
047/01 0,316 db 081/01 0 db
## large Conductivity (Salinity) despiked/offset
segments
Several large segments of salinity
data were affected by
conductivity sensor fouling and were
offset before finalizing
corrections. The largest segments (most consecutive
pressure
intervals) affected are listed
below, with the approximate
offsets used to shift them back to match nearby
data. More
nearby levels may have also been
despiked to
sta/cst CTD Pressures Salin.Offset
012/01 2064 - 2746db +0.0005 (to
bottom)
015/01 2332 - 2350db +0.0015
019/01 2124
- 2136db +0.012 to +0.013
019/01 2138 - 2146db +0.001 to
+0.002
020/03 2822 - 2832db +0.002
024/01 0 - 708db -0.004
024/01 708 - 740db (despike area between offsets)
024/01 740 - 746db +0.003
024/01 748 - 758db +0.0005
036/01 172 - 418db +0.002
044/01 0 - 1754db +0.001 to +0.002 (upcast)
044/01 1766 - 1792db +0.001
044/01 1804 - 1820db +0.0025
045/01 1626 - 1704db +0.001
046/01 1832 - 1844db +0.001
049/01 2708 - 2716db +0.002
050/01 1044 - 1058db +0.002
062/01 1522 - 1546db +0.0005
066/01 1670 - 1718db +0.002
074/01 0 - 602db -0.001
077/01 436 - 490db +0.247 to +0.254
## possible equilibration or freezing problems:
The following 4 casts recorded
unrealistic (high) temperatures, followed
by rapid drops to near-freezing
temperatures, before the cast went in
the water. This was likely caused by (too-)warm water being poured over
the sensors because of freezing problems. It's possible this can distort
some temperature-related lags
applied to the CTD data (because the
internal CTD temperature at power-up
was assumed to also be this warm).
(Quote from station 71 cast 1
console log: "It is necessary to use
warm house for CTD and rosette
under cold winter condition. It
will be better for sensors and
sampling.")
sta/cst possible equilibration issue
028/01 pre-cast T starts at 25.8 deg.C, rapidly drops to -3.0
deg.C; 5 mins.
at -3 to 0 deg.C before going in
water (surface T -0.1 deg.C)
030/01 pre-cast T starts at 14.9 deg.C, rapidly drops to -3.2
deg.C; 2 mins.
at -3 to 0 deg.C before going in
water (surface T -1.0 deg.C)
072/01 pre-cast T topped-out/above 31.3 deg.C several seconds, then
rapidly
drops to 4.5 deg.C just before
going in (surface T -0.33 deg.C)
073/01 pre-cast T topped out at 31.3 for 15 seconds, then rapidly
drops to 10.9 deg.C just before
going in (surface T 1.5 deg.C)
The lowest pre-cast (out-of-water)
temperatures are listed below for any
cast with below-freezing (corrected)
air temperatures. There is
potential
for sensor freezing problems, especially
in the near-surface data. Known
problems have been fixed where
possible by using a later start-time for
pressure-sequencing, thereby
bypassing data affected by freezing, or using
upcasts when the effect went too
deep on the downcast. (Stations
72/73
off-scale high temperatures were
also noted here, as well as casts where
data files started in-water in areas
likely to have had freezing problems.)
Freezing can/probably did affect
every CTD sensor (including oxygen and
transmissometers) at some point
during this cruise.
pre-cast pre-cast
sta/cst min. Temp. sta/cst min. Temp.
022/01 -0.5525 048/01 -2.6476
023/01 -0.4244 056/01 -0.4209
028/01 -3.0342 057/01 (starts in-water)
028/02 -6.1325 058/01 -0.0101
029/01 -5.5658 060/01 -0.3682
030/01 -3.1880 061/01 -4.9496
031/01 (starts in-water) 062/01 -5.9051
032/01 -3.8577 063/01 -3.1086
033/01 -5.5239 064/01 -3.2502
034/01 (starts in-water) 065/02 -4.1711
035/01 -5.8765 066/01 -4.1904
036/01 -5.0503 067/01 -3.6343
037/01 -5.6170 069/01 -1.2976
038/01
-5.0917 070/01 -2.5099
039/02 -7.5768 071/02 -1.4948
040/01 -9.6729 072/01 (O/S high T)
041/01 -10.3604 073/01 (O/S high T)
042/01 -9.6942 074/01 -1.5064
043/01 -7.8414 075/01 -1.1550
044/01 -6.3074 076/01 -2.4055
045/01 -5.6152 077/01 -2.0856
046/01 -5.5009 078/02 -1.4280
047/01 -3.6713 079/01 -1.8981
## Oxygen data not reported: malfunctioning sensor
sta/cst
sta/cst
040/01 076/01
041/01 077/01
042/01 078/02
043/01 079/01
044/01 080/01
045/01
046/01
047/01
048/01
## nearby cast's oxygen corrections used instead of default
(to avoid problems in data file):
sta/cst Corrxns used sta/cst Corrxns used
021/01 022/01 050/01 051/01
027/01 026/01 053/01 052/01
036/01 037/01 054/01 051/01
038/01 037/01 055/01 051/01
039/02 037/01
Appendix
B: Station, rosette and bottle
data quality comments (I. Zhabin)
KH38 quality comments -
console log sheets, sample log sheets, bottle sample log book, salt, oxygen,
nutrients analysis logs. (Compiled by I. Zhabin at sea on the Khromov)
Codes:
qflg = 4 bad value
qflg = 3 suspicious value
qflg = 2 good value
Leg 1 (test cruise):
Station 001 01
CTD 5, big Rosette
Surface samples for CO2
group in line bottle 25.
DLOG - bottle 23 too high
(qflg=4).
Station 002 01
CTD 5, big Rosette.
Surface samples for CO2
group in line bottle 25.
Station 003 01
CTD 5.
Surface samples for CO2
group in line bottle 25.
Station 004 02
CTD 5.
Surface samples for CO2
group in line bottle 25.
Station 005 01
CTD 5, big Rosette.
Surface samples for CO2
group in line bottle 25.
DLOG - 104 SiO3 low
(qflg=3)
104 PO4 low (qflg=3)
Station 006 01
CTD 5, big Rosette.
Surface samples for CO2
group in line bottle 25.
Station 007 01
CTD 5, big Rosette.
Surface samples for CO2
group in line bottle 25.
Station 008 01
CTD 5, big Rosette.
Surface samples for CO2
group in line bottle 25.
Station 009 01
CTD 1, small Rosette.
Double surface samples for
CO2 group in line bottle 25.
Station 010.01
CTD 5, big Rosette
Surface samples for CO2
group in line bottle 25.
Primary cruise, northern
Japan Sea
no GPS data between 22:17
and 23:10 02 Mar 2000. GPS didn't work.
Change GPS.
Station 011.01
Surface samples for CO2
group in line bottle 25.
Salt box number (NT-17) in
Small volume sample log is wrong,
correct -003 in rs-files.
DLOG AUTOSAL - computer
reset during standartize (two start worm).
edit files RS/01101 and 01101.lst. Original
files saved as 01101.svd and 01101d.lst
114- salt high (rerun?). qflg=4
Station 012.01
Surface samples for CO2
group in line bottle 25.
Bottle N6 - stopcock leak
CTD conductivity offset in
upcast.
Station 013.01
Surface samples for CO2
group in line bottle 25.
no GPS data in navlog.txt
between 04:01 and 11:41 03 Mar 2000
GPS work, unknown reason
data lost (operator's mistake?).
Problem with ejection of
videocassete from VCR
DLOG AUTOSAL - 112-salt
seems high (qflg=4)
110- low (qflg=3)
108,109 -salt high (qflg=3)
106- sample bottle close badly.
variability of AUTOSAL
salt is high in comparison with CTD.
Operator was change during
measurements.
Station 014.01
Surface samples for CO2
group in line bottle 25.
DLOG - bottles 01, 02 - no
oxygen, Dosimat or computer problem.
Measurements continue after
computer programm reset.
AUTOSAL - 103 salt seems high
(qflg=3).
116 salt high (qflg=3).
No GPS data in navlog.txt
between 20:04 and 21:24 03 Mar 2000.
unknown reason, GPS work.
Station 015.01
Surface samples for CO2
group in line bottle 25,26,27.
DLOG - small variations in
O2 and nuts in bottom layer
(bottle 1-6). PO4-NO3 relation
curve differ from other
stations. Probably OK
(qflg=2).
Station 016.01
Surface samples for CO2
group in line bottle 25,26.
DLOG - 102,103 -oxy seems
slight low. Probably OK (qflg=2).
small variations NO3 in deep water (101-105).
Probably OK (qflg=2).
AUTOSAL - after bottle 22
pump don't work. Repair of autosal 57-396 pump.
Station 017.01
Surface samples for CO2
group in line bottle 25,26.
Station 018.01
Surface samples for CO2
group in line bottle 25.
DLOG - AUTOSAL - 101 salt
high in constant S layer (qflg=4).
106 salt too high (qflg=4).
103-105 salt high (qflg=4).
Sample warming during measurements?
Station 019.01
Surface samples for CO2
group in line bottle 25.
Small strong cyclone,
rough weather between St. 19 and 20
After strong wind GPS
don't work. Change GPS antenna before Sta.20.
DLOG - AUTOSAL 102 - salt
very highin constant S deep water (qflg=4).
103 -salt high (qflg=4).
104 -salt high (qflg=3).
110 -salt high (qflg=3).
112 - salt to high(qflg=4).
nuts 101 - NO3 low (qflg=3).
oxy 104 - o2 high. Probably OK
(qflg=2).
Station 020.01 - CTD -
computer error during down cast.
Station 020.02 - CTD - up
cast from 600 m.
Station 020.03
Surface samples for CO2
group in line bottle 25.
DLOG - nuts -no NH3
measurements, electric cable break.
Station 021.01
Surface samples for CO2
group in line bottle 25.
DLOG - 117,118 -low oxy
and high nuts (qflg=2).
Station 022.01
Surface samples for CO2
group in line bottle 25.
CTD - no confirm on SBE
unit after bottles 23 and 24.
Bottles don't closed. Edited
02201.bot file.
Original file saved as 02201sav.bot
.
No all informations in 02201.nav. Added 02201.nav
from console operations log.
Original file saved
as 02201sav.nav.
DLOG -Surface samples
taken through CO2 Sea Cat system (oxy,nuts,salt).
Stored in H00 file as bottle 24. CTD
data for bottle 24 line
taken from 02201sav.bot.
AUTOSAL - 112,113 salt too high
(qflg=4).
nuts - 105,106
NO3 low (qflg=3).
Station 023.01
Surface samples for CO2
group in line bottle 25.
DLOG - AUTOSAL -108,109 salt high (qflg=4).
117 salt high (qflg=4).
122- salt low (qflg=4).
Station 024.01
Surface samples for CO2
group in line bottle 25.
CTD - wrong ALT depth in
02401.nav
DLOG - AUTOSAL 103,106,118
salt high (qflg=3)
113- salt high (qflg=4)
nuts - SIO3 high (qflg=3).
Station 025.01
Surface samples for CO2
group in line bottle 25.
No GPS data in
navlog.txt between 14:13 and 21:38
05 mar 2000.
GPS OK.
CTD - Bottle 6 was not
closed. The rest worked OK.
When operator pushed button B on
console to close bottle 6,
it was not closed. Instead of this
bottle 7 was closed.
Next botle that got closed on
Rosette was 8,9,...24. However
in the 02501.bot file the serial
numbering of the bottles kept as
standard (1,2,3,4,5,6,7,8,...23 !).
These means that botlle
6 in 02501.bot.file actually
corresponds to bottle 7 on Rosette,
7 - 8, ... 23 - 24.
Edited 02501. bot file. Original
file saved as 02501sav.bot.
DLOG - 102 oxy high
(qflg=3).
nuts variations in deep water
(101-108)
108 - NO3 and SiO3 high
(qflg=3).
Station 026.01
Surface samples for CO2
group in line bottle 25.
CTD salinity spikes in
upper 500 m layer. Front?
DLOG - 104 NO3 and SiO3
high (qflg=3).
Station 027.01
Surface samples for CO2
group in line bottle 25.
DLOG -AUTOSAL 117 -salt
high. Salt intrusion on 450 db. OK
101,103,104 - salt high (qflg=4).
107 -salt high (qflg=4).
nuts 102 - NO3 low (qflg=3).
Strong northern wind
(20m/c).Due to storm weather r/v moved to
the Peter Great Bay.
Due to frizing of water in
bottles AUTOSAL measuremens of salinity
are noisy for minus air
and water temperature.
Information about frizing
bottles in SV Sample Log is not full.
Station 028.01 (first St. in the Peter Great Bay).
Bottles don't closed -
minus water and air temperature.
Station 028.02
Surface samples for CO2
group in line bottle 25.
Some bottles don't closed.
Problem with sampling-
stopcocks froze. Hair fan
was used to melt ice in stopcocks and
provide water flowing from
bottles.
Closed bottles- NN 1,4,7,12,20,21,22?
DLOG - AUTOSAL - no end worm std
due to asal programm interrupt.
Check a
connection between AUTOSAL and computer.
AUTOSAL
power off -power on. New calibration for
02901 (first
worm std) used as end worm in
02802 and
02802.lst. Original saved as 02802.sav
and
02802sav.lst.
No salt box
in SV Sample Log, Check salinometr Log.
C10 is
correct.
224 - salt,
nuts extra line ? No in SV Sample Log.
Samples
taken from Sea Cat CO2 system.
Stored in
H00 file as bottle 24. CTD data from bottle 24 line.
All salt
seems noisy. Probably, due to samples frizing on a deck.
Station 029.01
Surface samples for CO2
group in line bottle 25.
SLOG - Triple bottles on
each depth. One sample on each depth.
Samples taken from bottles N
1,5,8,11,12,14,16,18,20,22,23,24.
Minus air temperature -samples
froze on a deck during sampling
procedure
DLOG - no comments.
Station 030.01
Surface samples for CO2
group in line bottle 25.
CTD - depth in stacst file
seems wrong.
Station 031.01
Surface samples for CO2
group in line bottle 25.
Small Rosette CTD-1.
Cheking of salinity in
upper layer samples is hard due to using
Small Rosette CTD-1.
CTD - bad information in
03101.nav. Original file
saved as 03101sav.nav. No depth and
position data in 03101.nav.
03101.nav edited according
navlog.txt
CTD programm start as CTD - 5,
restart for CTD - 1. Edited file
03101.bot. Original saved as
03101sav.bot.
Files 03101.scr and 03101.raw in CTD
computer was empty after
station. VCR work well. Probably
03101.nav in CTD computer was
corrected in different manner.
SLOG - Minus air temperature -bottles froze on
a deck during sampling
procedure.
Bottle N 17 didn't
closed.
DLOG - AUTOSAL 101, 103 -not enough water in
salt bottle
Station 032.01
Surface samples for CO2
group in line bottle 25.
Small Rosette CTD-1.
SLOG - Minus air
temperature -bottles froze on a deck during sampling
procedure
Bottle N 9 - did't closed.
DLOG AUTOSAL 103 - not enough water in
samples for AUTOSAL
116 - not enough water, measurement was done.
104 - salt high (qflg=4).
108, 113 - salt too high (qflg=4).
119 - salt high(qflg=3).
nuts 111
- PO4 low (qflg=4).
122 - NH3 high (qflg=4).
Station 033.01
Surface samples for CO2
group in line bottle 25.
Small Rosette CTD-1.
CTD salinity spikes in
upper layer.
SLOG - Minus air
temperature -bottles froze on a deck during sampling
procedure
Bottles 6, 10 didn't closed.
DLOG - AUTOSAL -109 - not
enough water in samples. No measurement.
107 - salt too low. Not enough water in Salt Bottle (qflg=4).
101 - salt high (qflg=4).
Nutrients on Sta. 33 have
suspricious high values in comparision with
neighbouring station
Bottom SiO3 > 100 uM/l.
Adjust time in NOBELTEC
programm (probably 7 Mar 2000). Difference
between real time and
computer time was about 5 minutes.
Station 034.01
Surface samples for CO2
group in line bottle 25,26.
Small Rosette CTD-1.
CTD - strong salinity
offset in upper layer downcast. Upcast OK.
SLOG - Bottles N 7, 16
din't closed.
bottles 2,6,14 - no water for
salt, no measurements (CFC sampling).
Minus air temperature -bottles
froze on a deck during sampling
procedure
CTD- two position info in 03401.nav
file. Wrong deleted. Original
saved as 03401sav.nav.
DLOG - AUTOSAL - 108,110,
113 salt too low - not enough water in
Sampling Bottle for good measurements (qflg=4).
112 salt low (qflg=4).
Check and care computer
against viruses.
"Monkey" virus
on O2 floppy.
Station 035.01
Surface samples for CO2
group in line bottle 25.
Small Rosette CTD-1.
Bottles N 2, 15 din't
closed.
Bottle N 16 leak prior to
venting.
No salt box number in SV
Sample Log. CC9 is correct according
Salinometr Log
DLOG - AUTOSAL - 101 salt
high -not enough water in Samp. Bottle (qflg=4).
101 oxy and NO3 low (qflg=4).
107 oxy and nuts bad (qflg=4). Bottle can close on
another depth.
Station 036.01
Surface samples for CO2
group in line bottle 25.
Small Rosette CTD-1.
CTD - salinity offset
(500-1100).
SLOG - Bottles N 15, 24 din't
closed.
DLOG - Surface samples taken from
Sea Cat CO2 system.
Stored in
H00 file as bottle 24, CTD data from bottle 24 line.
Oxy seems
too low and very noisy. Bed ficsation of samples by
operator.
All hyddata
profiles have suspicious values.
Women's Day
in Russian.
Station 037.01
Surface samples for CO2
group in line bottle 25.
Small Rosette CTD-1.
CTD - Problem with numeration of bottles in
.bot.
from bottle 1 to 10 - correct,
11 or 12 is absent in 03701. bot.
After 11 in .bot numeration of
bottles is uncorrect...
Edit 03701.bot according SV
Sample Log, Console Op Log.
Pressure and tripped time in
Console Op Log and .bot files
was used as information for
checking.. Original file
saved as 03701d.bot.
SLOG - bottle 24 didn't
closed. It's correct. (According Console
Oper. Log - bottle 1 didn't
closed).
Double bottles on 1500, 1020,
600, 160, 33 depth.
One sample from repeat
bottles.
Bottle N 16 leak prior to
venting.
DLOG - AUTOSAL - 101 -
salt high- not enough water in Sampling Bottle (qflg=4).
102 - salt high (qflg=4).
107 - salt high (qflg=4).
0109 before 0120 -wrong bottle
number. 0119 is correct.
Change bottle number from 0109
to 0119 in RS\03701 and 03701.lst.
Bottle 3 - sample taken, no
salt measurement. Depth same
as bottle 2.
Station 038.01
Surface samples for CO2
group in line bottle 25.
Small Rosette CTD-1.
CTD - slope, Rosette touch bottom.
Conductivity very noisy
upcast near bottom. Bottle N
8,10-15,18? was damage or take
a sediments.
Bottles N 4,7,22 didn't close.
Problem with numeration of
bottles in .bot.
Edit 03801.bot according SV
Sample Log, Console Op Log.
Pressure and tripped time in
Console Op Log and .bot files
was used as information for
checking..
Duplicate bottle 23 line as
bottle 24 in 03801.bot.
Original file saved as
03801d.bot.
SLOG - Bottles N 4,
7,8,11,12,13,14,15,16,18,22,24 didn't closed
according Console Op Log.
Probably, bottles 4,7,22 didn't closed.
According SV Sample Log
samples was taken from bottles
1,2,3,5,6,9,10,15,16,17,19,20,21,23,24. Probably, SV Sample
Log information is correct.
Use in edition of 03801.bot file.
No information about salt and
nuts bottle N in SV Sample Log.
DLOG - AUTOSAL - Bottle 1
- not enough water.
Bottles 6,9 -samples taken,
but no salt data.
102 - salt high (qflg=4).
109 - oxy high, NO3, PO4 high,
SiO3 low - bottle was
damage during bottom touch
(qfgl=4).
116 - Oxy high (qflg=4).
101 - bottle close during
contact with botom (qflg=4).
Station 039.01
Surface samples for CO2
group in line bottle 25.
Small Rosette CTD-1.
CTD - Problem with
pressure sensor.
Station 039.02
Surface samples for CO2
group in line bottle 25.
Small Rosette CTD-1.
CTD - Problem with numeration of bottles in
.bot.
Edit 03902.bot according SV
Sample Log, Console Op Log.
Pressure and tripped time in
Console Op Log and .bot files
was used as information for
checking..
Original file saved as
03901d.bot.
SLOG - Bottles N 8 is
absent in SV Sample Log. Did't closed?
Bottles N 9, 11 are absent
(repair).
Bottles 10 in Console Op. Log
is wrong. Surface samples
taken throught Sea Cat CO2
system. Save in H00 as bottle N24.
In SV sample Log cast N is
wrong. 2 is correct.
DLOG - AUTOSAL -
salinometr data stored in RS\03801 and
03801.lst as 038 02. Files
edited, change station
number. Original saved as
03801.svd and 03801d.lst.
Bottle 1 - salt high -not
enough water (qflg=4).
0224 - Samples taken from Sea Cat CO2 system.
206 - oxy high, PO4 too high,
NO3 low (qflg=4). Two lines
(205 and 206) on 90 db depth
with different values. Probably,
206 can be deleted as bed.
Station 040.01
Surface samples for CO2
group in line bottle 25.
Small Rosette CTD-1.
CTD - oxygen very noisy.
SLOG - Bottles N 3, 5, 11
didn't closed.
Bottle N 17, 16 leak prior to
venting.
Bottles N 24 is absent
(repair).
All bottles frose.
DLOG - AUTOSAL 118,123 no
water for salt.
113 - salt too high, sample is a mixture between
bottles 13 and 14 (qflg=4).
120,122 - salt too
high (qflg=4).
nuts 101 - NO3 too high (qflg=4).
Station 041.01
Surface samples for CO2
group in line bottle 25.
Small Rosette CTD-1.
CTD - oxygen very bad.
SLOG - Bottle N 11 didn't
closed.
Bottle N 17 leak prior to
venting.
Bottles N 23, 24 are absent
(repair).
All bottles frose.
DLOG - nutrients -110 not
enough water for measuremets.
102,103 nuts low (qflg=3).
AUTOSAL - Bottle 17,18 - not enoug water for salt
(1/2)
Bottles
1,10,12,19 - no water for salt.
in samples (qflg=3)
122 - surface salt too high (qflg=4).
Station 042.01
Surface samples for CO2
group in line bottle 25.
Small Rosette CTD-1.
CTD - oxygen very noisy. Bad.
SLOG - Bottle N 24 is
absent (repair).
Bottle N 3,10,20,21 - not
enough water for salt (1/2 salt bottle)
Bottle N 2, 11 leak after to
venting.
Some bottles froze.
DLOG- 102 oxy too high. Sample taken from
leaking bottle N 2 (qflg=4).
101,109 -salt too high
(constant S deep water). (qflg=4)
112 -salt high (qflg=3).
nuts - 103-109 - variations
NO3 (qflg=3).
Station 043.01
Surface samples for CO2
group in line bottle 25.
Small Rosette CTD-1.
CTD - no oxygen, sensor
died.
salinity bad downcast in upper
layer. Upcast OK.
SLOG - Bottle N 5 sock was
broken (no sampling?).
- Bottle N 16 didn't closed.
Bottle N 14,15,17,18 - no
water for salt.
DLOG - nuts -106 PO4 too
high (qflg=4).
variations
of NO3 in deep and bottom layers (qflg=3).
AUTOSAL - 109, 111 too low
(qflg=4)
107 - high (qflg=3).
Station 044.01
Surface samples for CO2
group in line bottle 25.
Small Rosette CTD-1.
CTD - no oxygen, sensor
died.
salinity offset (500-1800)?
Added 04401.nav file used by Con.
Op. Log data.
Original saved as NAV/04401sav.nav.
SLOG -Bottle N 9 - not
enough water for salt (1/2 salt bottle)
Bottle N11 - leak prior to venting.
DLOG -Bottle N 20 -two
samples of oxy.
102 - all line of parametrs seems
unreal. Bottle close at another depth
in upper layer (qflg=4). Delete 102 line from H00. Saved in
H00.sav.
105 - salt high, oxy low, nuts too
high (qflg=3).
AUTOSAL - dial 265 is wrong, correct
value is 280.
107- salt high (qflg=4).
Station 045.01
Surface samples for CO2
group in line bottle 25.
Small Rosette CTD-1.
CTD - no oxygen, sensor
died.
SLOG - Bottle 9 -stopsock
leak
DLOG - 102 - oxy, nuts
bad. Bottle close at other depth (qflg=4).
Delete line 102 from H00, save
in H00.sav.
106 - nuts high (qflg=3).
108 - oxy too low (qflg=4),
nuts high (qflg=3).
111 - salt too high (qflg=4).
Station 046.01
Surface samples for CO2
group in line bottle 25.
Small Rosette CTD-1.
CTD - no oxygen, sensor died.
strong salinity offset in
upper layer downcast. Cond. cell frouzen ?
Downcast off set and noisy in
upper part (0-120 m). Upcast OK.
SLOG - Bottle 9 -stopsock
leak
Bottles 19,20,21,22,23,24
frozen
Bottle N 9 - not enough water
for salt (80 ml in salt bottle)
measurement was done.
DLOG - variability of nuts
in deep water (bottles 101-107) seems
high (qflg=3).
Station 047.01
Surface samples for CO2
group in line bottle 25.
Small Rosette CTD-1.
CTD - no oxygen.
SLOG- Bottle N 2 didn't
closed.
DLOG - nuts - 105 NO3 high (qflg=3).
Station 048.01
Surface samples for CO2
group in line bottle 25.
Small Rosette CTD-1.
CTD - no oxygen.
DLOG -104 - bottle close
at other depth (about 1000) qflg=4.
105 - bottle close ar other depth
(near surface) qflg=4.
109 - bottle close at other
depth (about 300) qflg=4.
Delete 104, 105, 109 lines from H00.
Save in H00.sav.
Station 049.01
Surface samples for CO2
group in line bottle 25.
Big Rosette CTD-5.!!!!!!
SLOG - winch stop downcast
(depth about 500 m).
CTD - oxygen noisy. After
frost?
DLOG- AUTOSAL -
101,102,104,106,108,113 salt high in constant S
deep layer (qflg=4).
nuts 102 NO3 low (qflg=3).
Station 050.01
Surface samples for CO2
group in line bottle 25.
Big Rosette CTD-5.
CTD - oxygen noisy.
DLOG - AUTOSAL computer
error after first worm std.
New
calibration after reset.
101 salt high (qflg=4).
nuts 105 NO3 low (qflg=3).
Station 051.01
Surface samples for CO2
group in line bottle 25.
Big Rosette CTD-5.
CTD - oxygen noisy.
Station 052.01
Surface samples for CO2
group in line bottle 25.
Big Rosette CTD-5.
CTD - oxygen noisy.
DLOG- oxy 108 oxy high (qflg=3).
nuts 106 NO3 low (qflg=3).
103
NO3 high (gflg=3).
Station 053.01
Surface samples for CO2
group in line bottle 25.
Big Rosette CTD-5.
CTD - oxygen noisy.
DLOG - 108
-salt high in constant S deep layer (qflg=4).
111 -salt high (qflg=3).
nuts - 101 NO3 low, 105 NO3
high (qflg=3).
Station 054.01
Surface samples for CO2
group in line bottle 25.
Big Rosette CTD-5.
CTD - oxygen noisy.
SLOG - No N of bottles in
SV Sample Log. Only 14 salt bottles from
15 depth. Surface salt sample
be lost.
Adjust time in NOBELTEC
nav.computer (03:13 -> 03:31 11 Mar 2000). Difference
between real time and
computer time was about 18 minutes.
Slowly computer clock.
Station 055.01
Surface samples for CO2
group in line bottle 25.
Big Rosette CTD-5.
Winch stop upcast (1100
db).
CTD - oxygen noisy.
DLOG - nuts 102 NO3 high
(qflg=3)
Station 056.01
Surface samples for CO2
group in line bottle 25.
Big Rosette CTD-5.
CTD - oxygen noisy.
DLOG AUTOSAL -
102,103,106,115 salt too high (qflg=4).
121 high (qflg=4).
oxy- 112
high. Probably OK (qflg=2).
nuts- 102,105 NO3
high (qflg=3).
101- NO3 low (qflg=3).
Station 057.01
Surface samples for CO2
group in line bottle 25.
Big Rosette CTD-5.
CTD - oxygen noisy.
DLOG - 105,106 - weak NO3
max.
Change time on navlog
computer from AM to PM 00:38 12 Mar.
11:11 -> 01:16 12 Mar
(5 min break) again PM during Station 058.01.
May be problem in
05801.nav?
Station 058.01
Surface samples for CO2
group in line bottle 25.
Big Rosette CTD-5.
CTD - oxygen noisy.
DLOG - 101 salt high in
constant S deep water (qflg=4).
Check "stacst"
file. Station time in Console Op. Log and stacast may
be different due to navlog
computer time problem. Probably operators
sometimes used ship GMT
time in Console Op. Log (ship clock time is correct).
Station 059.01
Surface samples for CO2
group in line bottle 25.
Big Rosette CTD-5.
CTD - change oxygen
sensor.
extra lines in 05901.bot (extra sta.
info after data).
Deleted extra lines. Original saved
as 05901b.bot.
Two position info in 05901.nav.
Edited. Original saved
as 05901sav.nav
Monday, 13.
Station 060.01
Surface samples for CO2
group in line bottle 25.
Big Rosette CTD-5.
SLOG - Not enough cable on
a winch to reach bottom (strong drift of vessel).
Winch stop (3000) upcast.
Cable demage due to rolling.
Cut injure part of cable.
DLOG - AUTOSAL 110 - salt high (qflg=4).
oxigen 109 - oxy high. Computer
error during titration. (qflg=4).
101 - oxy high (qflg=4).
Boot sector O2 floppy
infected by "Empire. Monkey" virus again.
Scan O2 computer - traces
of Monkey virus in memory (probably, Monkey
lived in O2 computer long
time. We traces this virus in summer KH36
cruise on O2 floppy). No
time for care O2 comp.
Station 061.01
Surface samples for CO2
group in line bottle 25.
Big Rosette CTD-5.
All cable was used due to
strong vessel drift.
SLOG- Bottles from 11 to
24 were frozen.
DLOG- AUTOSAL
-114,119,122,123 salt high (qflg=4).
Frozen bottles during sampling?
nuts - strong variability in bottom layer (101-109)
qflg=3.
Station 062.01
Surface samples for CO2
group in line bottle 25.
Big Rosette CTD-5.
CTD- No connection with
Rosette. Chek connectors?
Pressure sensor didn't work in upper
layer.
Downcast to 12 db and then go to surface.
After that downcast again.
DLOG - oxy 115 - O2 low. CTD O2 also show O2
min. OK (qflg=2).
101 - no data. Operator mistakes.
Station 063.01
Surface samples for CO2
group in line bottle 25.
Big Rosette CTD-5.
CTD - oxy spike 450 m
Slope - depth from echosounder were
noisy. Due to
this reason Rosette didn't go close
to bottom.
Power source for altimetr died?
DLOG - nuts 103 NO2 high
(qflg=3).
Station 064.01
Surface samples for CO2
group in line bottle 25.
Big Rosette CTD-5.
DLOG - AUTOSAL - end worm
std low. Drift =-0.001 Three measurements end worm
in RS\06401 - 1.99978 1.99971 1.99976.
First and third seems OK.
Station 065.02
Surface samples for CO2
group in line bottle 25.
Big Rosette CTD-5.
CTD computer restart
before station. 065.01 is empty.
In SV Sample Log wrong N
cast (1). Change cast number in RS\RN\RO files
and rename fales from
06501 to 06502before merging. Files in
Salt, Nuts, Oxy computers
(may be) with wrong (1) cast number.
DLOG - AUTOSAL drift
0.0016?
202 salt high in constant S layer (qflg=4).
nuts
119 -no data?
Station 066.01
Surface samples for CO2
group in line bottle 25.
Big Rosette CTD-5.
CTD - salinity offset
upcast from 1000 db.
SLOG salt box number 1B in
SV Sample Log and 001 in RS\files. 001=1B.
Station 067.01
Surface samples for CO2
group in line bottle 25.
Big Rosette CTD-5.
Organic matter in oxygen
flask N 1658.
Station 068.01
Surface samples for CO2
group in line bottle 25.
Big Rosette CTD-5.
Station 069.01
Surface samples for CO2
group in line bottle 25.
Big Rosette CTD-5.
DLOG AUTOSAL 110 -salt
high (qflg=3).
Station 070.01
Surface samples for CO2
group in line bottle 25.
Big Rosette CTD-5.
Bottle 6- Corc didn't close before station.
DLOG - AUTOSAL 104 salt
high in constant S layer (qflg=4).
Station 071.01
Surface samples for CO2
group in line bottle 25.
Big Rosette CTD-5.
CTD Sensor didn't work due
to frezing.
Only CTD cast in upper
layer.
Station 071.02
Surface samples for CO2
group in line bottle 25.
Big Rosette CTD-5.
Bottles N 8,10 froze. O2
draw temp. in SV Sample Log (bottles 8-9)
low.
DLOG AUTOSAL 110 salt
high. Bottle frozen during sampling (qflg=4).
Station 072.01
Surface samples for CO2
group in line bottle 25.
Big Rosette CTD-5.
Station 073.01
Surface samples for CO2
group in line bottle 25.
Big Rosette CTD-5.
Station 074.01
Surface samples for CO2
group in line bottle 25.
Big Rosette CTD-5.
Station 075.01
Surface samples for CO2
group in line bottle 25.
Big Rosette CTD-5.
Adjust time in NOBELTEC
programm (probably 15 Mar 2000). Difference
between real time and
computer time was about 5 minutes.
Station 076.01
Surface samples for CO2
group in line bottle 25.
Big Rosette CTD-5.
CTD oxygen sensor work bad
downcast.
DLOG AUTOSAL - 101,103
salt high in constant S layer (qflg=4).
oxy - 101 low (qflg=3).
Station 077.01
Surface samples for CO2
group in line bottle 25.
Big Rosette CTD-5.
CTD oxygen sensor work bad
downcast.
Two position info in
07701.nav. Deleted. Saved in 07701sav.nav.
Two bottle trip data lines
in 07701.bot. Edited. Saved in 07701d.bot.
DLOG AUTOSAL - 102 salt
high (qflg=4).
Station 078.02
Surface samples for CO2
group in line bottle 25.
Big Rosette CTD-5.
CTD oxygen sensor work bad
downcast.
DLOG - AUTOSAL 201 -salt
high (qflg=4).
CTD computer restart
before station. 078.01 is empty.
Change cast number in RN\
files from 1 to 2.
and rename RN\ fales from
07801 to 07802 before merging. Files in
Nuts computers have wrong (1) cast number.
Station 079.01
Surface samples for CO2
group in line bottle 25.
Big Rosette CTD-5.
CTD oxygen sensor work bad
downcast.
SLOG - bottle 1 didn't
close.
Station 080.01
Surface samples for CO2
group in line bottle 25.
Big Rosette CTD-5.
CTD oxygen sensor work bad
downcast.
DLOG AUTOSAL - 108 salt
high(qflg=3).
Station 081.01
Surface samples for CO2
group in line bottle 25.
Big Rosette CTD-5.
Comments
CTD - after survey check
E\CTD\ *.scr files in CTD computer.
00101.scr,03401.scr,04601.scr,05201.scr,05901.scr
-no data.
Probably will be rewrite
from ZIP100 disk.
Problem: NavLog computer
have a slow clock. During cruise computer time
was corrected three times
(may be more) according with real time.
Final time difference is
about 30 min (may be more). For correction
navlog time can be use
data korean Sea Cat GPS (on floppy discs).