 Lynne Talley, Fall, 2019
This pdf also includes the Atmospheric Circulation slides.
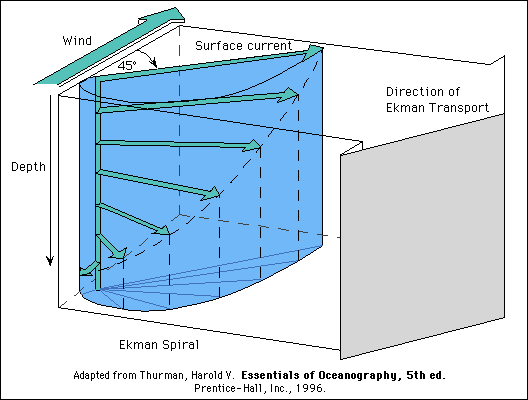
If the "transports" are all added up, that is, integrate the velocity over depth at each location, from the bottom to the top of the Ekman layer, the total "Ekman transport" is exactly at right angles to the wind - to the right in the northern hemisphere and left in the southern hemisphere. This direction of the "Ekman transport" is independent of the exact details of the spiral, hence exact details of the vertical eddy viscosity.
The Ekman transport components in the x and y directions (east and
north) are proportional to the wind stress tauy and
taux, in the y and x
directions:
(UEk,VEk) =
(1/rho*f)*(tauy, - taux).
The units are: m2/sec, since this is actually just a velocity
integrated in the vertical direction, and not over an area.
Total Ekman transport across, for instance, a vertical section or line
or curve across the ocean, or around a box, would then be integrated
along the horizontal curve, yielding a complete transport in
m3/sec.
This Ekman effect has been demonstrated by Ralph and Niiler (1999) using surface drifter data from the Pacific (drogues at 15 m). (Figure 7.8 in DPO 6th)
2. Other wind effects in addition to surface waves and Ekman flow: Langmuir circulation
(See DPO section 7.5.2, with much more explanation in the supplementary chapter S7.5.2.)
3. Surface mixed layers: buoyancy and turbulent mixing
(See DPO section 7.4)
2. Draw a schematic of an open ocean wind field that produces Ekman convergence in the southern hemisphere.
3. Compare the Ekman layer thickness and the observed global surface mixed layer thickness. Where would Ekman layers be contained within the winter surface mixed layer and where would they extend below it?
4. Compare the timescales of surface waves, Langmuir circulation, inertial circulation and a fully-developed Ekman layer.
Study calculation
A steady wind field is blowing on a rectangular ocean basin
8000 km wide. At 25oN, the wind blows from the east at a
speed of u10=8 m/s. At 40oN, the wind blows
from the west at a speed of u10=8 m/s. What is the rate
of wind-driven Ekman mass convergence between 25oN and
40oN (in kg/s)? What is the average Ekman pumping (in cm/s) between
25oN and 40oN? [1 degree of latitude = 111.12
km].