For Nov. 11 introduction, look at slides 1-7 only.
DPO Chapter 14, intro, 14.1, 14.2, 14.4
Other reading and resources:
"Grand tour of the oceans' water masses" (Jim Swift, using JOA)WOCE Atlases for vertical sections and some maps of properties (Pacific, Atlantic, Indian, Southern)
The wind-driven circulations of each subtropical region include an poleward western boundary current and anticyclonic circulation. Just offshore and equatorward of the separated western boundary currents is found the relatively thick layer that we have called Subtropical Mode Water, shown in red in the figure, with schematic cyclonic streamlines to indicate the subtropical gyre. These are around 16 to 19C in each ocean. The pink regions in the figure indicate a lower density subtropical mode water of the poleward/eastern portions of the subtropical gyres. This was not discussed in the lectures, and is mentioned only here for completeness. These eastern STMWs are subducted into the subtropical circulations. Not shown in the figure is the location of the Subtropical Underwaters of each subtropical ocean (should be added to the figure).
The other mode waters discussed in class and shown in the figure are the Subpolar Mode Water of the North Atlantic's subpolar gyre (thick mixed layers evident in the previous winter mixed layer map) and the Subantarctic Mode Water (the thickest part shown as the brown patch in the mode water map).
Location of warm, upper ocean mode waters (Figure), including the Subtropical Mode Waters (around 18C) of each subtropical gyre (red). Lower density subtropical type mode waters of the eastern region of each subtropical gyre (not included in class discussion) (pink). Subpolar Mode Water of the North Atlantic, Subantarctic Mode Water north of the Subantarctic Front (only the region of deepest mixed layers is shown), North Pacific Central Mode Water (not discussed in class - Suga et al., 1997) (brown). Schematics of the gyre circulations are indicated as well, but are clearly just cartoons. (From Talley, 1999 with update in Hanawa and Talley, 2001.)
The intermediate waters of the world ocean are usually traced by their salinity extrema. The two salinity maximum intermediate waters are formed in marginal seas in the high evaporation zone of the subtropics. These are the Mediterranean and Red Sea Waters, the former entering the North Atlantic at mid-depth and the latter filling the northern Indian Ocean (neither shown in the figure). The three low salinity intermediate water masses are formed at high subtropical or subpolar latitudes from surface water that has relatively low salinity. The three intermediate waters have different formation processes (in the regions marked by X in the figure). North Pacific Intermediate Water is formed from shelf water in the Okhotsk Sea, densified by brine rejection, mixed with North Pacific water in the Kuril Straits and including the low salinity surface waters of the Oyashio. It is a salinity minimum only in the North Pacific's subtropical gyre, but ventilates the entire subpolar region as well, where it does not have a salinity extremum. Labrador Sea Water forms through open ocean convection in the western Labrador Sea, from relatively fresh surface water. Since it sinks to mid-depth, below the inflowing more saline surface waters of the subpolar gyre, it appears as a salinity minimum throughout the subpolar gyre. Its influence is traced southward along the western boundary into the subtropical gyre and on into the tropical Atlantic through its relatively large thickness (resulting from its convective source) and through high oxygen. Antarctic Intermediate Water is a high latitude subtropical water mass, formed as the densest of the thick Subantarctic Mode Waters where the Antarctic Circumpolar Current is farthest south, just west of Chile. The SAMWs are located just north of the ACC and hence are in the subtropical gyres of the southern hemisphere. AAIW is subducted northward into the South Pacific's subtropical gyre. Part of the AAIW flows eastward through Drake Passage and enters the combined South Atlantic and Indian subtropical gyre through mixing in the Falkland (Malvinas) Loop.
Location of the three major salinity minimum intermediate waters (Figure). The X's mark the primary formation regions for each to the water masses. North Atlantic - Labrador Sea Water (extent of the potential vorticity minimum). North Pacific - North Pacific Intermediate Water (extent of salinity minimum in subtropical gyre, and indication that the ventilated water also completely covers the subpolar gyre, although NPIW is not a salinity minimum there since the surface waters are even fresher). Southern hemisphere - Antarctic Intermediate Water (extent of salinity minimum; extension of high silica northward in the subpolar North Atlantic is not indicated). Hatching indicates regions where mixing is critical to formation and modification. Clearly mixing occurs elsewhere as well, but these special areas set the properties for much larger regions. (From Talley, 1999.)The global influence of North Atlantic Deep Water is shown by salinity on a global isopycnal (Reid and Lynn, 1976) - showing high salinity originating in the North Atlantic and spreading southward and then eastward around Antarctica and entering the Indian and Pacific Oceans.
The influence of Antarctic Bottom Waters is illustrated with the location of a deep isopycnal (next figure), which is the lowest density water of Antarctic origin that is clearly separated from the Nordic Seas Overflow Waters (in the western North Atlantic). All higher densities south of the northern North Atlantic of course have significant Antarctic influence. At somewhat lower densities, one must more carefully differentiate between the Nordic Seas and Antarctic influences.
Location of isopycnal sigma_4 = 45.92 (Figure). (From Talley, 1999.)Bottom properties from Mantyla and Reid show the northward penetration of the cold Antarctic waters, into the western South Atlantic, the eastern Indian and the western South Pacific. The coldest waters remain confined to the Antarctic. Bottom silica shows how globally the North Atlantic has the lowest silica (since it is the best ventilated of the oceans), and the northern Indian and northern North Pacific have the highest silica (oldest bottom waters).
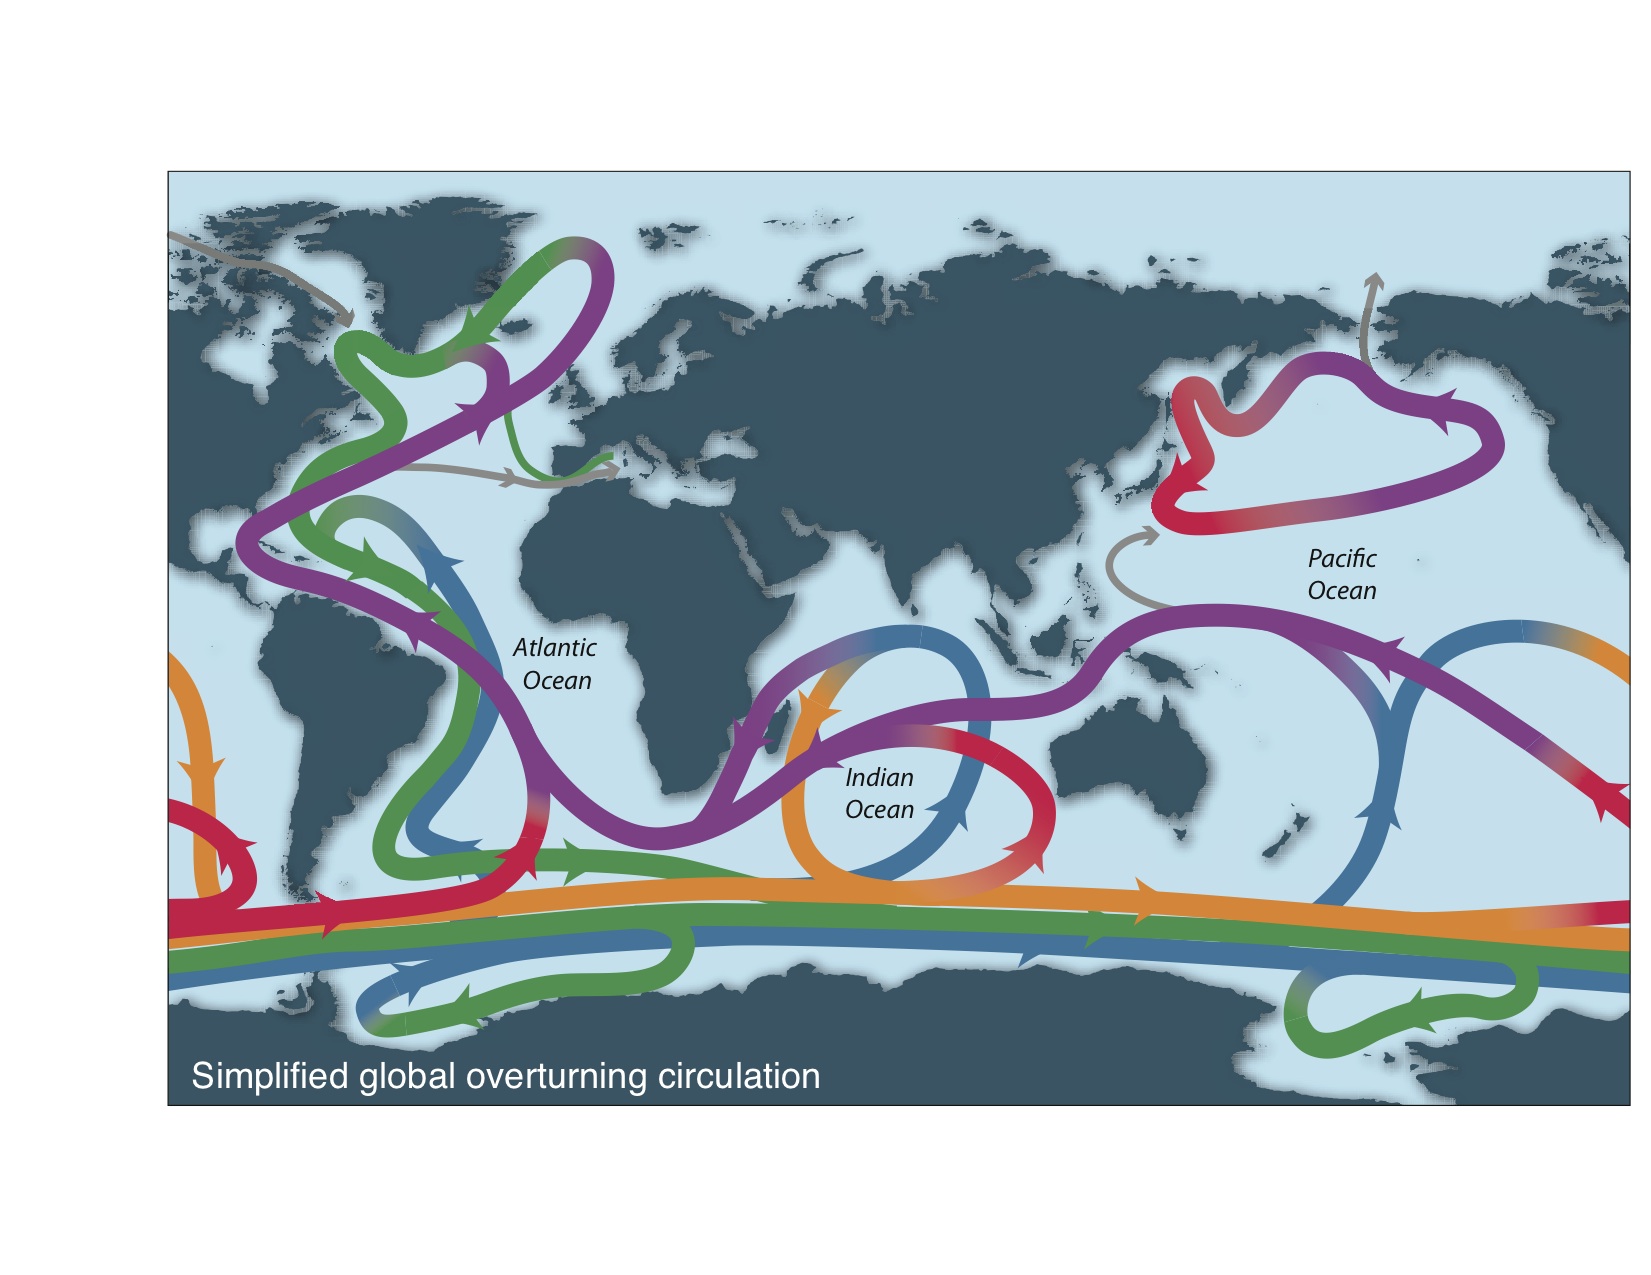
Returning to one of the global overturning diagrams from Schmitz, we now look more carefully at the Antarctic sources as well as the North Atlantic sources of deepest waters. We divide the oceans again into four layers - thermocline, intermediate waters, deep waters and bottom waters.
The net meridional directions of water mass transports in each ocean are demonstrated with figures from papers showing net transport as a function of either depth of density. In the North Pacific (Roemmich and McCallister, 1989) we see the shallow overturning subtropical gyre in the upper ocean (northward Ekman transport balanced by southward gyre transport), and inflow at the bottom, returning southward at a level just above the bottom. In the South Pacific (Wunsch et al., 1983) the subtropical gyres are not clearly demonstrated. The AAIW (indicated as Circumpolar Intermediate Water) is shown moving northward. Northward inflow occurs at the bottom, and the thick Pacific Deep Water moves back to the south. In the North Atlantic (Roemmich and Wunsch, 1985), we again don't see the subtropical gyre well, but see northward flow of upper ocean waters, northward flow of Antarctic Bottom Water, and southward flow of North Atlantic Deep Water. In the South Atlantic (Rintoul, 1991), we see northward flow of AAIW and Upper Circumpolar Water, northward flow at the bottom (Antarctic Bottom Water, or Lower Circumpolar Water), and southward flow of the North Atlantic Deep Water. In the south Indian Ocean (Toole and Warren, 1993), we see northward flow of Circumpolar Water and North Atlantic Deep Water, and southward flow of thermocline water.
The total heat transports associated with these mass transports are shown on a map of net surface heat flux Superimposed on the figure (see powerpoint) are arrows and magnitudes (PW) of meridional ocean heat transport from Roemmich and Wunsch (1985, N. Atlantic), Rintoul (1991 - S. Atlantic), Robbins and Toole (1997- Indian), Roemmich and McCallister (1991 - N. Pacific), Wunsch et al. (1983 - S. Pacific). We note the northward direction of heat transport in the South Atlantic, in contrast with poleward heat transport in all other basins, due to location of northern hemisphere overturning (North Atlantic only, not North Pacific).